In 14-Jun’s Technical Blog following that week’s continuation of this year’s major bear trend below 20-May’s 3807 low, we discussed the possibility that that resumption of the bear from 31-May’s 4202 high could be the completing 5th-Wave of the INITIAL major 1st-Wave down of a massive, multi-quarter or multi-year bear market. IF this was the case, we noted that it was important for the market to arrest this year’s decline with a bullish divergence in at least short-term momentum in the “period immediately ahead”.
The market has not yet CONFIRMED this short-term mo failure, but the extent of this week’s recovery puts in on the brink of doing so above 15-Jun’s 3843 smaller-degree corrective high. Per such- and we’re jumping the gun here a little- such a bullish divergence would define 17-Jun’s 3639 low as the end of at least the portion of this year’s bear trend from 30-May’s 4202 high and possibly the end of a 5-wave sequence down from 04-Jan’s 4808 all-time high. As a direct result of this recovery, we’re defining 17-Jun’s 3639 low as one of developing importance as an admittedly short-term BULL risk parameter ahead of a prospective bear market correction higher that could result in a 15%-to-18% recovery in the month or two ahead.
Before getting into interest rate and S&P technicals specifically, we’d like to point out that the equity indexes are the absolute best “leading indicator” of the country’s and world’s economic performance. It leads or forecasts future economic behavior by 12-to-18-months. This year’s plunge warns of FUTURE economic slowdown and pain. And just recently, we’ve begun to see such pain being reflected in a number of commodity sectors and markets that have enjoyed enormous TWO-YEAR unprecedented mega-bull trends. Anywhere from the past three months to just this month of Jun, we’ve seen major peak/reversal behavior in:
- soybean oil (-20%)
- canola oil (-33.5%)
- palm oil (-28.5%)
- copper (-27%)
- cotton (-37.5%)
- lumber (-62%!!!)
Copper’s 27% plunge came after establishing a new all-time high at $5.0395 on 07-Mar. Is has demolished the past YEAR’S support around $4.000 and has reversed it’s 2-YEAR bull market from Mar’20’s $1.9725 low. Being an industrial metal, the past quarter’s reversal warns of a significant slowdown in industrial activity. Lumber’s meltdown suggests the same. We believe the energy complex- crude oil, diesel and gas- will be the next shoe to drop. And the massive 2-YEAR rampage in nat gas prices has reversed enough just since 08-Jun’s $9.664 high to allow us to forecast the end of its major bull market and start of a peak/reversal environment that could be major in scope.
We’ve also seen massive bull moves in the grain and livestock sectors. Cattle and hogs confirmed bearish divergence in WEEKLY momentum back in mar and May, respectively, and have arguably broken or at least threatened their secular bull markets, although recent rebounds/volatility are making the correction-vs-reversal debates challenging ones. Corn and soybeans, just this week, have broken larger-degree corrective lows and confirmed bearish divergences in weekly momentum also that satisfy the first of our three key reversal requirements.
So the good news is that we believe most if not all of the secular bull trends across all commodity sectors and markets is over. Topping PROCESSES can be challenging and take time before the (3rd-wave) brunt of these reversals lower take hold. The bad news is that these markets’ reversals are less likely to stem from over-supply and more likely to stem from reduced demand. Individuals “chasing” goods and services over the past couple years because of the stratospheric amounts of money injected into the economy will no longer be able to afford doing so, with unemployment very likely to rise or even jump. ALL of this has been suggested or forecast from this year’s major reversal in equity prices.
SEP 10-Yr T-NOTES
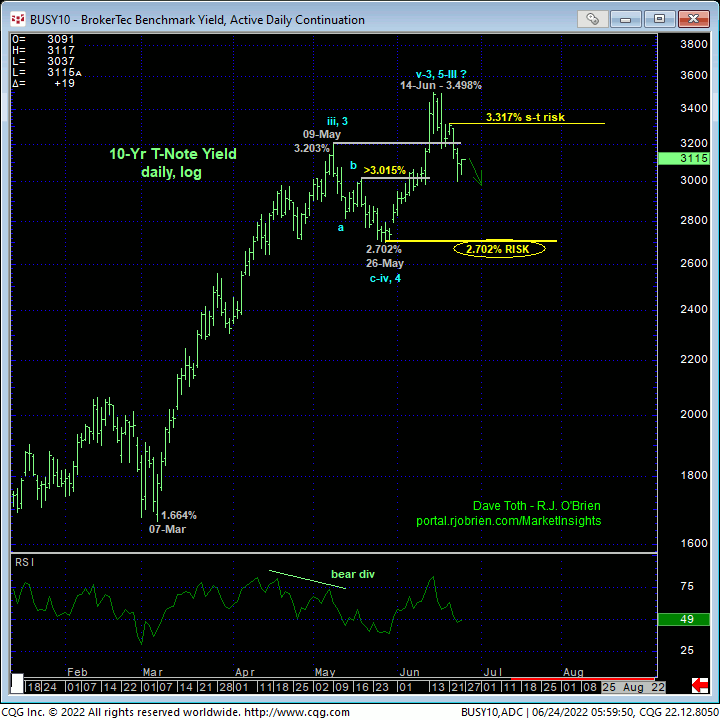
One of the more interesting reversals recently is that in the interest rate sector. In 17-Jun’s T-Note Technical Blog, we noted a bullish divergence in short-term momentum above 14-Jun’s 116.03 smaller-degree corrective high. This short-term mo failure defined 14-Jun’s 114.075 low as one of developing importance and the end of the decline from at least 26-May’s 120.195 larger-degree corrective high. Subsequent strength this week above 16-Jun’s 116.21 initial counter-trend high confirms the next level r scale of strength and leaves smaller-degree corrective lows in its wake at 116.255 and 115.225 that now serve as new mini and short-term risk parameters from which non-bearish decisions like short-covers and bullish punts can be objectively based and managed.
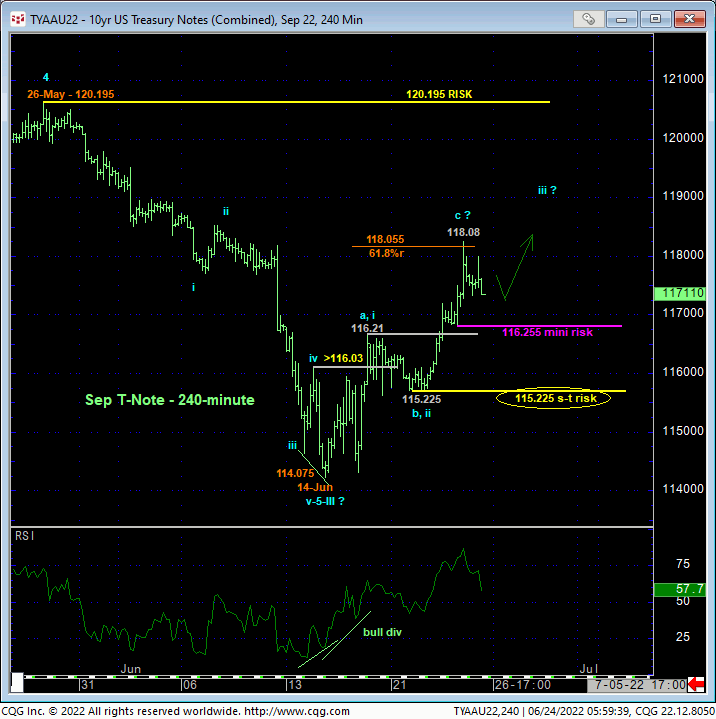
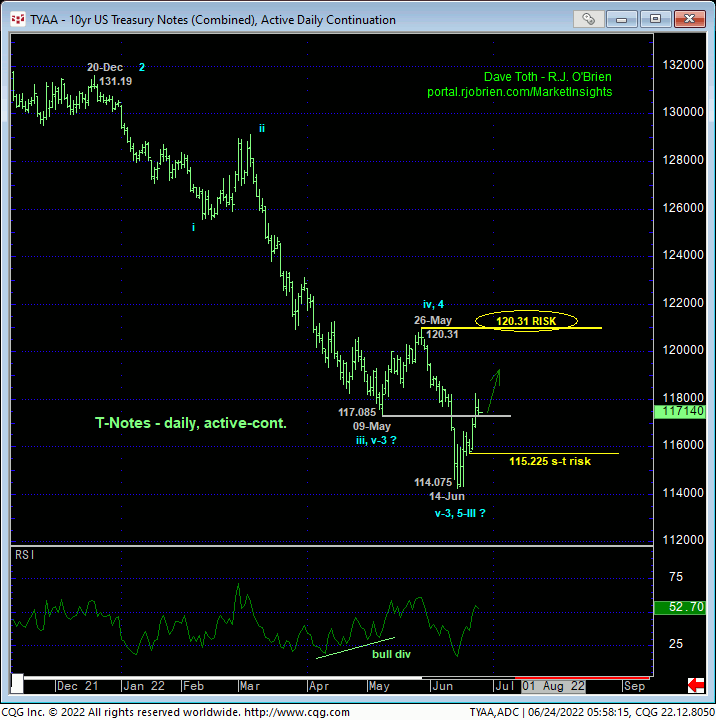
From a longer-term perspective, commensurately larger-degree strength above 26-May’s 120.31 larger-degree corrective high and key long-term risk parameter remains required to, in fact, break the secular bear trend in the t-note contract and expose a major correction higher. But by virtue of the past couple weeks’ recovery thus far, it’s not hard to envision 14-Jun’s 114.075 low as the end of the dramatic 3rd-Wave down from Aug’21’s 135.14 high, exposing a 4th-wave correction that could be extensive (i.e. above 120.31) and span months.
The drop to a near-4-year low of 38% in the Bullish Consensus measure of market sentiment/contrary opinion warns of such vulnerability to a recovery now that a bullish divergence in momentum has identified a more reliable low and support and thus bull risk parameter that renders contrary opinion an applicable technical tool. And the nicely developing POTENTIAL for a bullish divergence in WEEKLY momentum (below) would also seem to contribute to a larger-degree (4th-Wave) correction that could span a similar “area” to Apr-Aug’21’s 130.25 – 135.14 (2nd-Wave) correction.
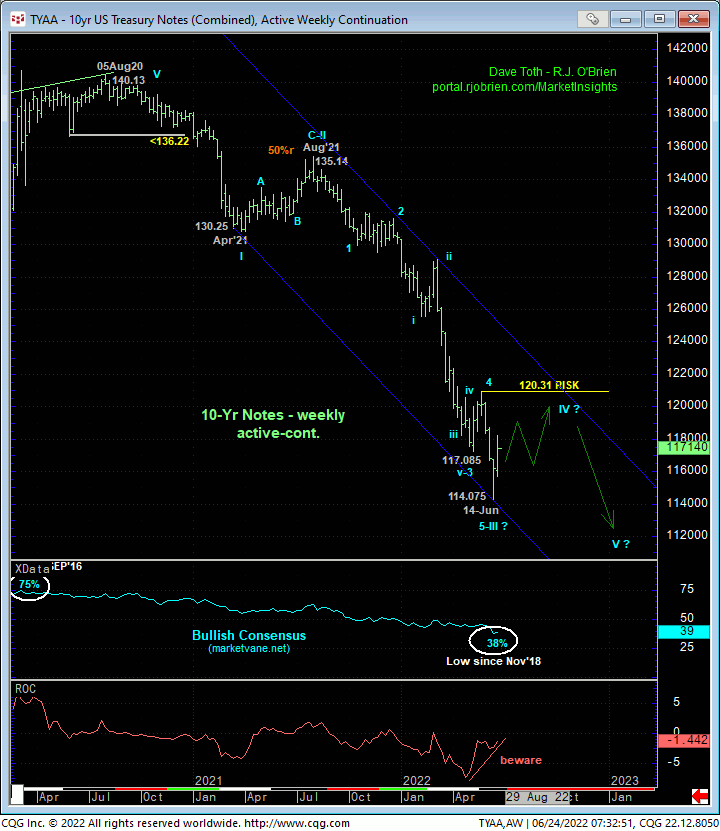
From a 10-yr rate perspective, the daily log scale chart below shows the thus-far 50-bp corrective setback from 14-Jun’s 3.498% peak, leaving 21-Jun’s 3.317% smaller-degree corrective high in its wake as the short-term risk parameter this market needs to sustain yields below to maintain a more immediate count calling for further yield drop. From a long-term perspective, to defer or threaten what we have forecast as a generational move higher in interest rates, a relapse below 26-May’s 2.702% larger-degree corrective low remains required.
These issues considered, this T-note contract has established a not-unusual situation where the short-term trend is up within the still-arguable long-term downtrend, with 115.225 and 120.31 the key directional flexion points and risk parameters traders are advised to toggle directional biases and exposure around commensurate with their personal risk profiles.
SEP E-MINI S&Ps
Falling commodity prices and slipping interest rates will be fertile ground for a recovery in equites that the media, economists and hopeful huddled masses will drool over in the coming months. And indeed, a recovery above 15-Jun’s 3843 smaller-degree corrective high will confirm a bullish divergence in momentum that will define 17-Jun’s 3639 low as the END of the decline from at least 30-May’s 4202 high. Per such and against the backdrop of this year’s 5-1/2-month 24% drawdown, this 3639 level provides an objective level from which to base and risk non-bearish decisions like short-covers and cautious BULLISH exposure.
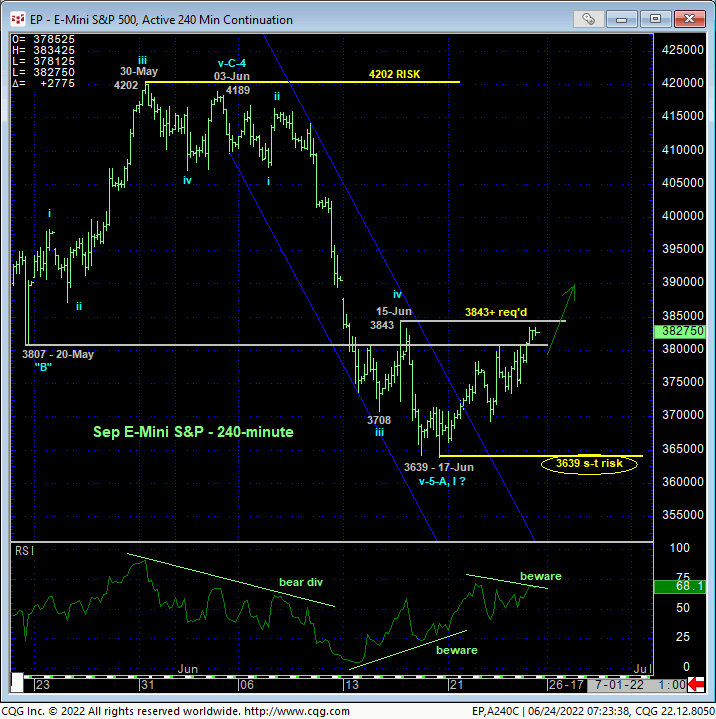

From a longer-term perspective, the magnitude of this year’s downtrend is clear in the daily (above) and weekly (below0 log scale charts. To break this downtrend, a recovery above 31-May’s 4202 larger-degree corrective high remains required. This is a technical fact. However and unfortunately, conducting “longer-term” non-bearish decisions “up there”, back in the middle of this year’s range, is about as impractical and suboptimal as it gets. Herein lies the importance of, admittedly, jumping the proverbial gun and considering non-bearish decisions (i.e. short-covers and bullish punts) “down here” and risking these decisions, quite objectively, to 3639.
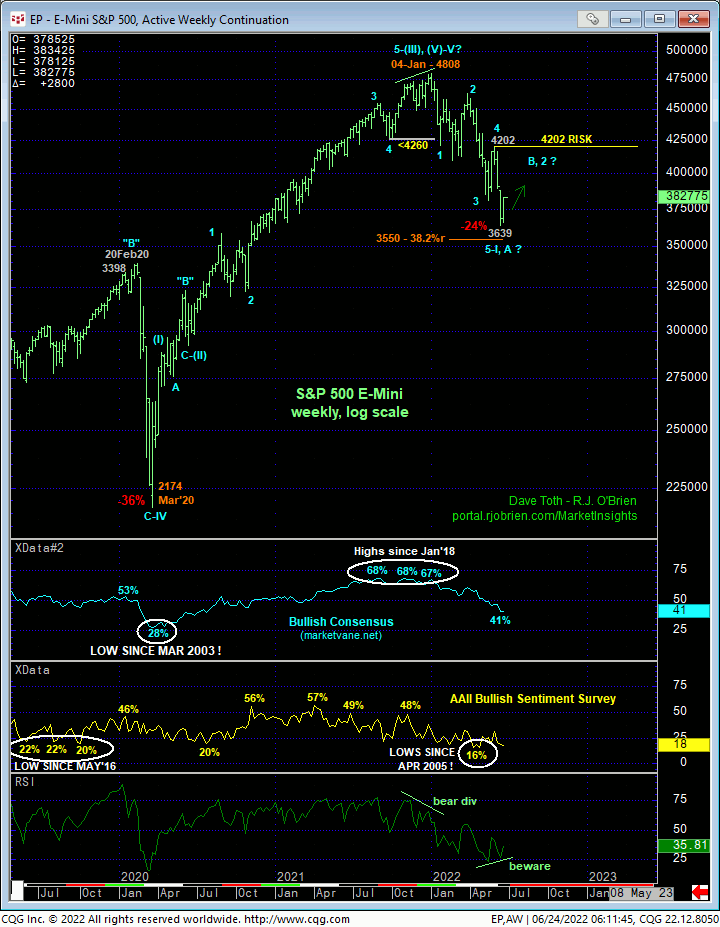
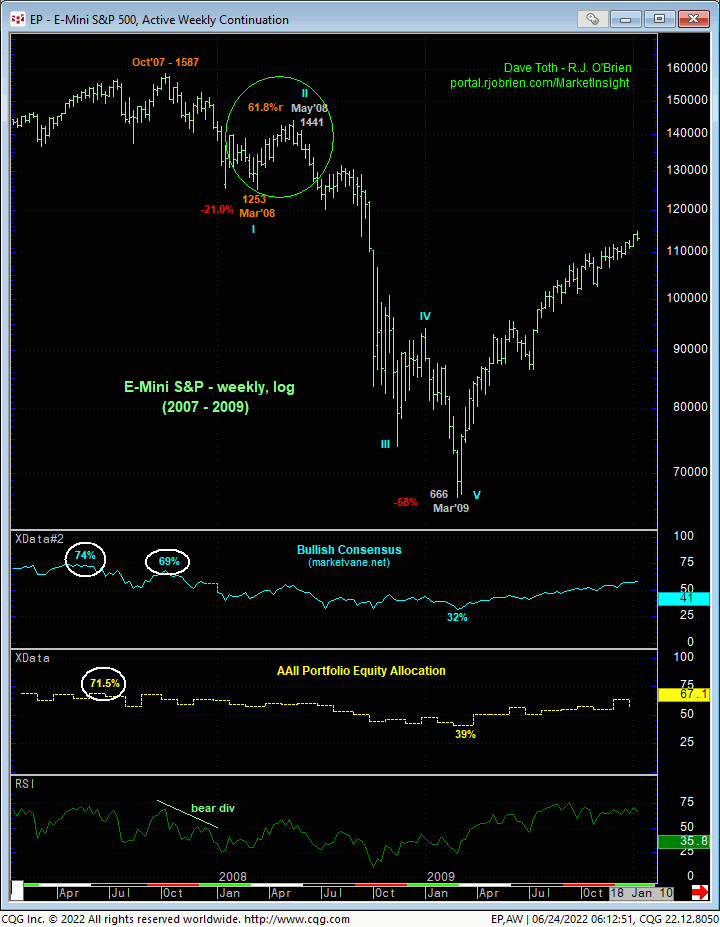
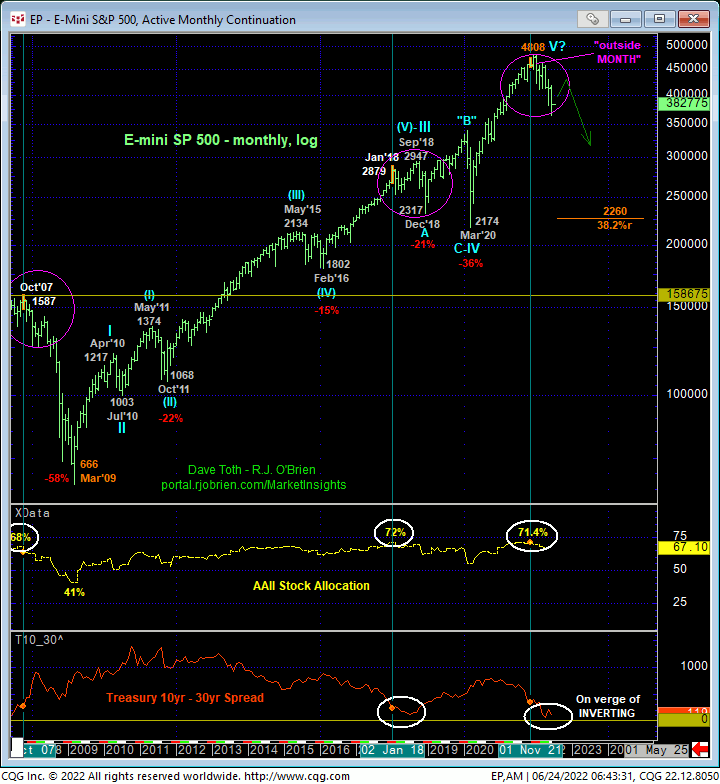
From a much longer-term perspective however, the long-term peak/reversal elements we introduced in 24-Jan’s Technical Blog remain intact until and unless negated by a recovery above 04-Jan’s 4808 high. We’ve equated these peak/reversal-threat conditions to previous major tops, corrections and reversals in 1Q2018, 4Q07 and 1Q2000. Notable WITHIN 2007 – 2009’s 17-month, 58% bear market was a 2-month bear market correction from 1253 to 1441 circled in green in the weekly log chart above. This recovery retraced an “extensive” 61.8% of Occt’07 – Mar’08s (1st-Wave) decline from 1587 to 1253 and, no doubt, provided hope to investors and economists.
Then the 3rd-Wave bottom fell out en route to an eventual 5-wave sequence to complete the bear market and a 58% erosion in portfolio equity valuation. For shorter-term reasons cites above, we believe this market could be on the verge of such a 2nd-wave correction of Jan-Jun’s 4808 – 3639 decline that could produce a recovery anywhere from 15%-to-18% (50%-to-61.8% retraces of the 4808 – 3639 decline) in the months ahead. A countering bearish divergence in momentum from “somewhere up there” would provide early warning of the 3rd-Wave debacle and massive opportunity from the bear side. But we’ll cross that bridge if/when the market gets us there.
These issues considered, traders are advised to pare or neutralize bearish exposure and even consider some cautious bullish exposure ahead of a correction higher that could prove extensive and span a month or two. A relapse below 3639 negates this call, warrants its immediate cover and reversal back into a bearish policy ahead of what could be extensive losses thereafter. In lieu of such sub-3639 losses, further and possibly surprising gains in the weeks ahead are anticipated.