MAR CRUDE OIL
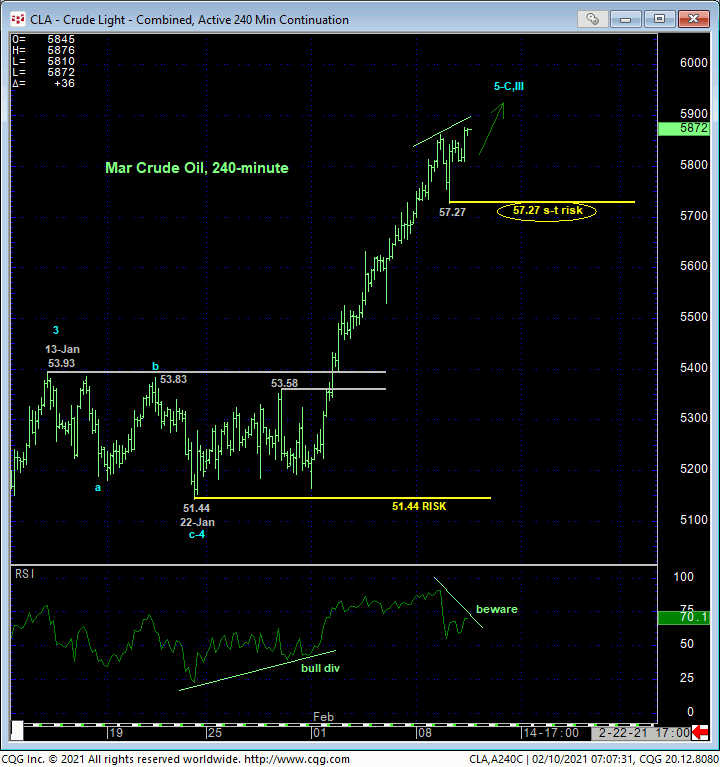
Today’s break above yesterday’s 58,62 high reaffirms the developing bull trend and leaves yesterday’s 57.27 low in its wake as the latest smaller-degree corrective low this market is now minimally required to fail below to confirm a bearish divergence in short-term momentum and expose even an interim corrective setback. Per such, this 57.27 level serves as our new short-term risk parameter from which shorter-term traders with tighter risk profiles can objectively rebase and manage the risk of a still-advised bullish policy and exposure. And with virtually no levels of any technical merit between 57.27 and former upper-53-handle-area resistance-turned-support, even longer-term commercial players can use this admittedly tight risk parameter at 57.27 to pare bullish exposure and exchange whipsaw risk (back above whatever high is left in the wake of such a short-term failure below 57.27) for much deeper nominal risk below 22-Jan’s 51.44 next larger-degree corrective low and key long-term risk parameter.
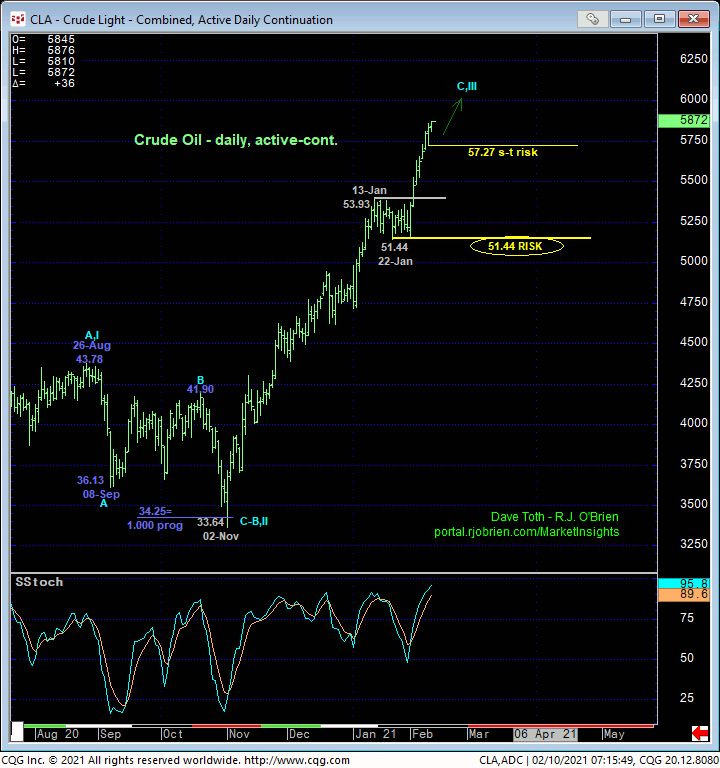
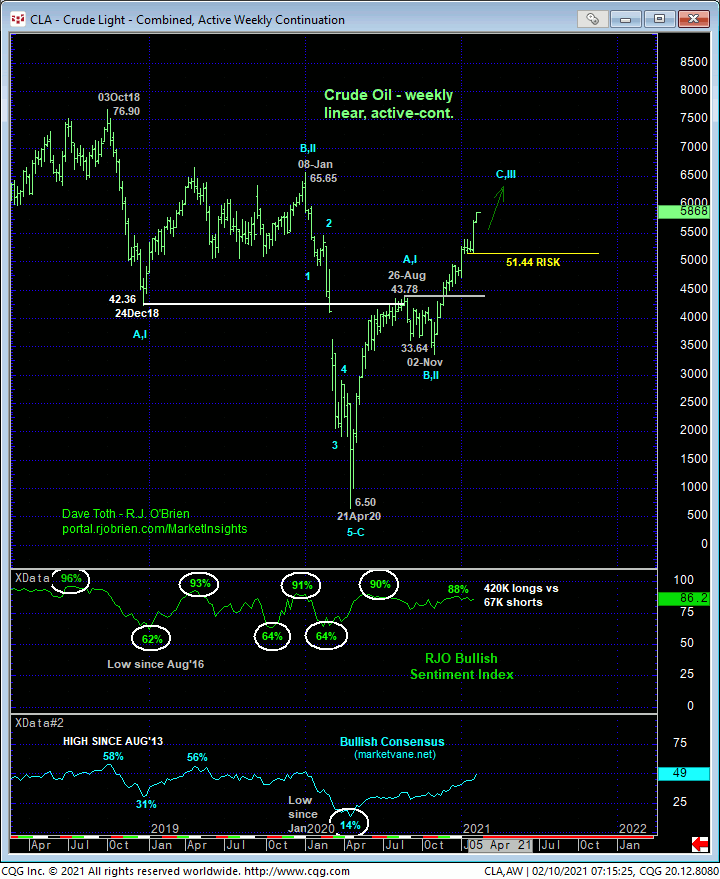
Indeed, on a longer-term basis shown in the daily chart above and weekly chart below, commensurately larger-degree weakness below 22-Jan’s 51.44 next larger-degree corrective low remains MINIMALLY required to break the uptrend from even 02-Nov’s 33.64 low, let alone the new secular bull trend from Apr’20’s 6.50 low. Per such, the technical and trading matter of SCALE comes into play. An admittedly very minor momentum failure below 57/.27 would, of course, be of too minor a scale to conclude anything more than another interim corrective hiccup, making it grossly premature for longer-term commercial players to exit a bullish policy.
Such a longer-term risk profile requires risking the position to 51.44. But since there’s no way to know what the market has in store if/when it fails below 57.27, the only other way to approach risk and non-bullish action is to acknowledge and accept shorter-term whipsaw risk (back above the high) for deeper nominal risk below 51.44. there is no other way because, again, there are NO levels of any technical merit around which to base an objective non-bullish act shy of former upper-53-handle-area resistance-turned-support. The only so-called “technical levels” between 57.27 and the upper-53-handle are “derived” from price data points like trend lines, Bollinger Band, imokus, the ever-useless moving averages and even the vaunted Fibonacci relationships we cite often in our analysis. And these derived levels have NEVER proven to be reliable reasons to identify support (or resistance) in the absence of an accompanying confirmed bullish (in this case) divergence in momentum. And they never will.
The weekly chart below shows market sentiment understandably reaching frothy heights typical of major peak/reversal environments. But trader are reminded that sentiment/contrary opinion is not an applicable technical tool in the absence of an accompanying confirmed bearish divergence in momentum needed to arrest the clear and present and major uptrend. Herein lies the importance of identifying corrective lows and risk parameters like 51.44 and even 57.27. In lieu of such proof of weakness below levels like these, and with no levels of any technical merit between spot and Jan’20’s 65.65 high, further and possibly accelerated gains should not surprise.
These issues considered, a bullish policy and exposure remain advised with a failure below 57.27 required for shorter-term traders to take profits and step aside and for longer-term players to pare exposure to more conservative levels to reduce the risk of a suspected interim correction of indeterminable scope. In lieu of weakness below at least 57.27, the trend is up on all scales and should not surprise by its continuance or acceleration.
MAR HEATING OIL
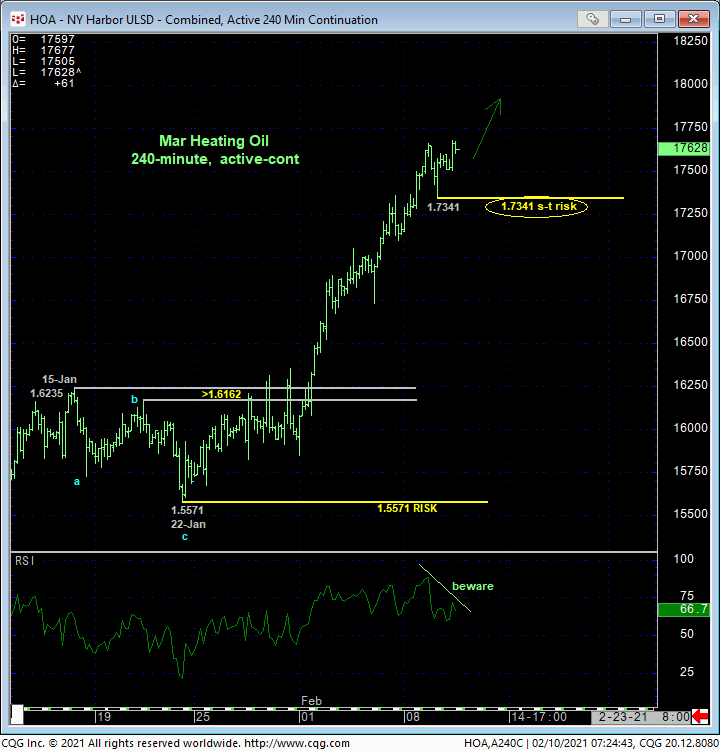
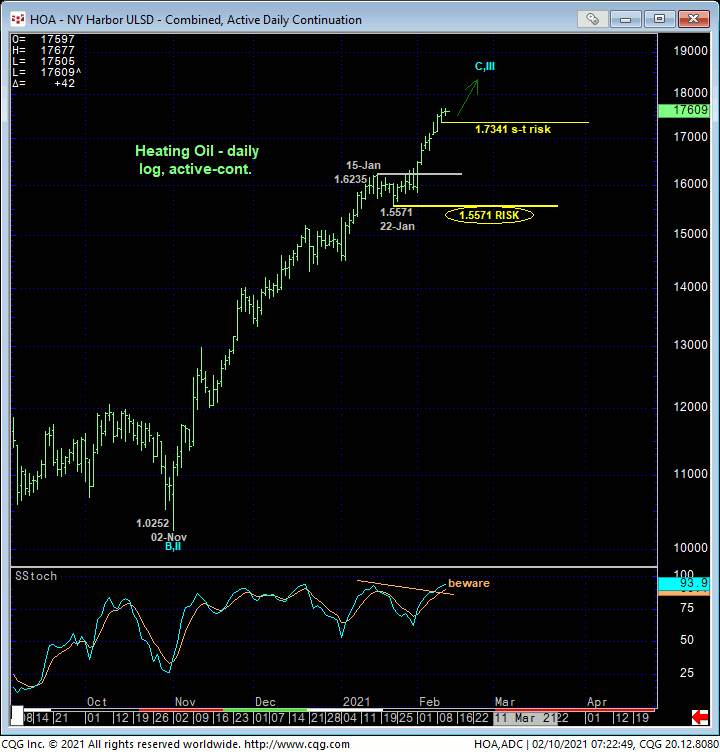
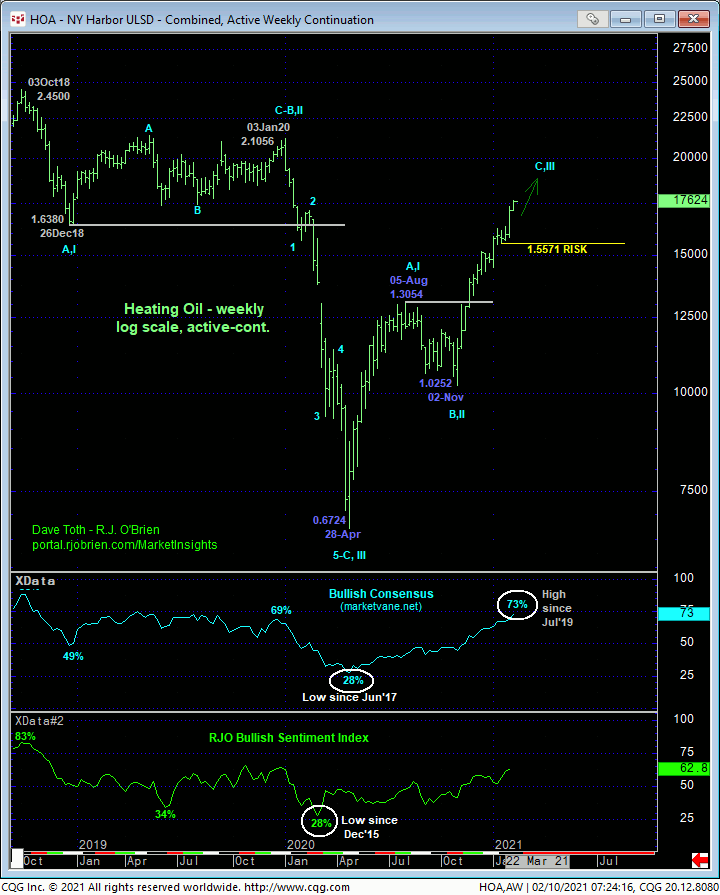
The technical construct and expectations for diesel are identical to those detailed above for crude with yesterday’s 1.7341 corrective low serving as our new short-term risk parameter, the break of which warrants a move to the sidelines by shorter-term traders and pared bullish exposure by longer-term players. In lieu of at least such sub-1.7341 weakness, further and possibly accelerated gains remain expected with no levels of any technical merit above the market shy of Jan’20’s 2.1056 high.
MAR RBOB

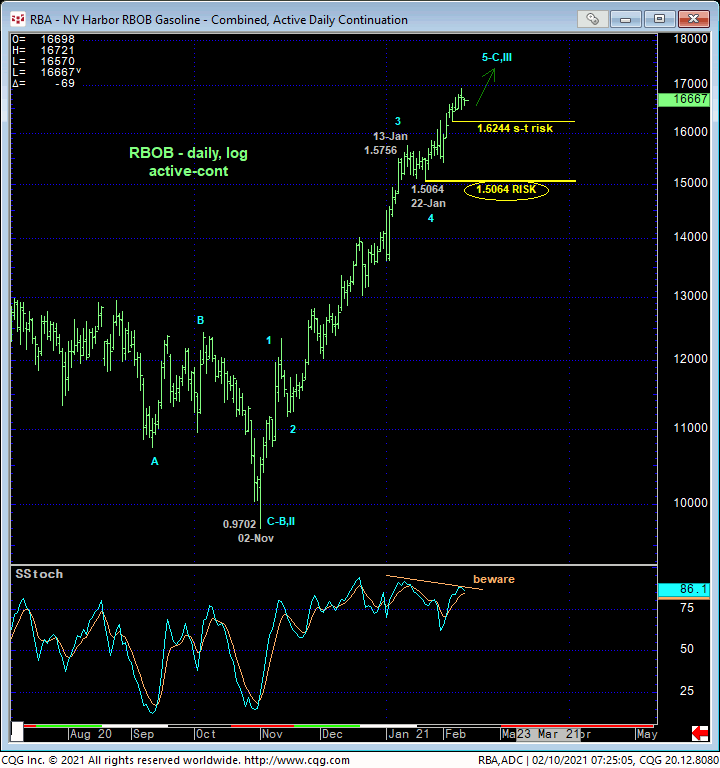
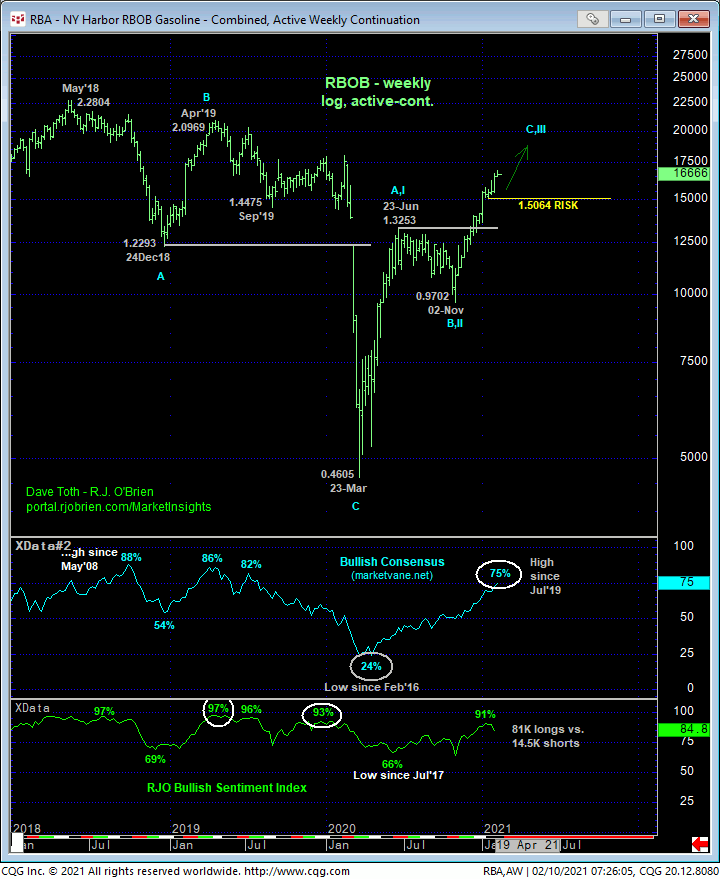
While RBOB hasn’t overtaken Tue’s 1.6924 high, a failure below 04-Feb’s 1.6244 smaller-degree corrective low is required to confirm a bearish divergence in momentum needed to stem the rally from at least 01-Feb’s 1.5410 low and expose an interim correction lower. Per such, this 1.6244 low serves as our short-term risk parameter from which shorter-term traders with tighter risk profiles can objectively rebase and manage the risk of a still-advised bullish policy and exposure. Commensurately larger-degree weakness below 22-Jan’s 1.5064 larger-degree corrective low and key risk parameter remains required to confirm a bearish divergence in momentum of a scale sufficient to break the uptrend from 02-Nov’s 0.9702 low and expose a correction lower that could be extensive in scope. In lieu of weakness below at least 1.6244 and preferably below 1.5064, the major bull trend is intact and expected to continue and perhaps accelerate.
