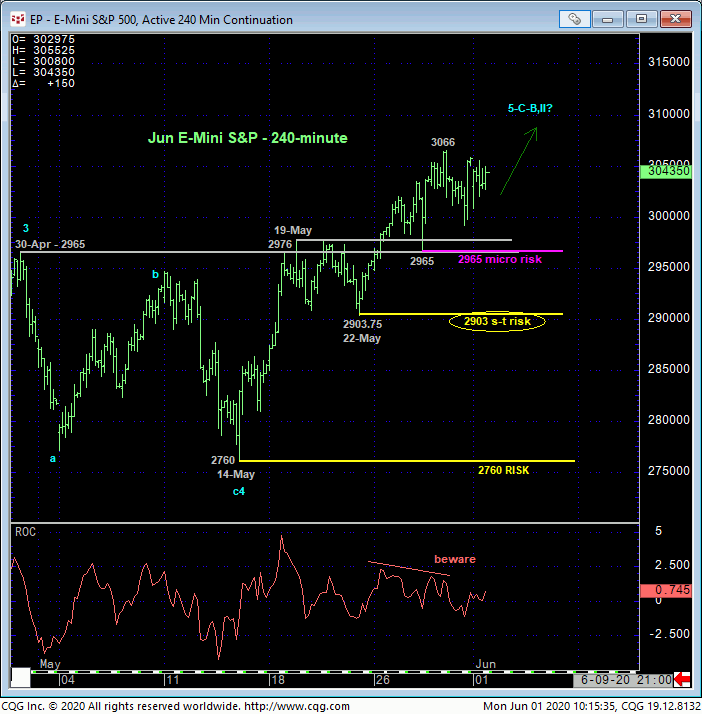
Last week’s break above the previous week’s 2976-area resistance reaffirms what has become a relatively impressive 10-week uptrend and leaves 27-May’s 2965 low in its wake as the latest smaller-degree corrective low this market is now required to sustain gains above to maintain a more immediate bullish count. The 240-min chart below also shows prior corrective lows of various scales at 2903 and 2760 that this market is fully expected to sustain gains above to maintain a bullish count. Its failure to do so will increasingly threaten the bull with a “larger-degree” momentum failure below 2760 not only breaking the 10-week uptrend, but resurrecting a peak/reversal count that could be major in scope. Until and unless such weakness is shown, further gains should not surprise. Per such, these 2965, 2903 and 2760 levels serves as our new micro, short- and long-term risk parameters from which a bullish policy can be objectively rebased and managed.
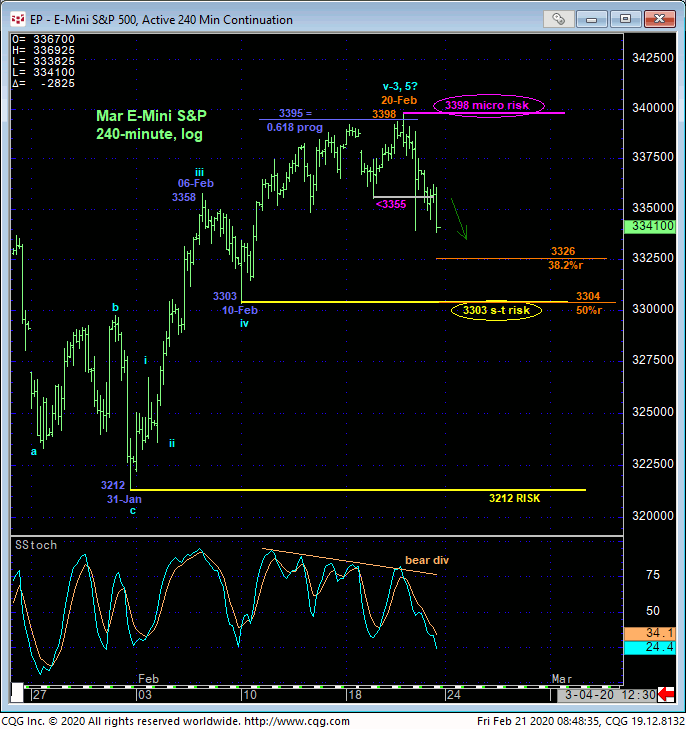
It’s interesting to compare the past few weeks’ rally and very specific, objective risk parameters to the three weeks’ price action that preceded 20-Feb’s 3398 all-time high and subsequent 36% meltdown that changed the world and may continue doing so. Back in mid-Feb and following 20-Feb’s new all-time high, we specific corrective lows and risk parameters of various scales- exactly like we did above- at 3355, 3303 and our “long-term” risk parameter at 3212. The total market collapse that followed is now in the history books. But our risk parameters provided specific and objective levels to pare and neutralize bullish exposure and reduce or eliminate the risk of the carnage that followed. For long-term reasons we’ll detail below, we cannot ignore the risk of another such meltdown, or worse, if/when the market fails below the levels specified above: 2965, 2903 and certainly 2760. As long as the clear and present uptrend keeps on keepin’ on, there’s no problem and a bullish policy remains advised.
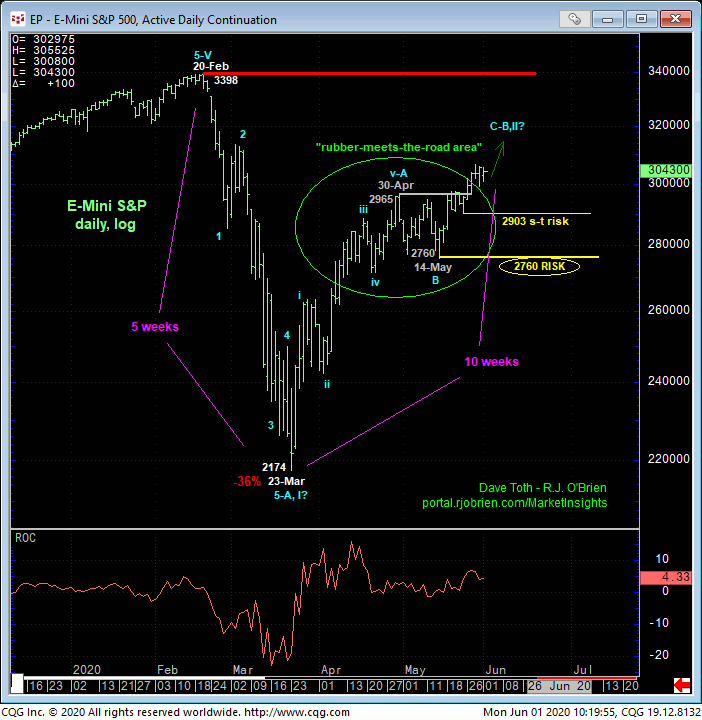
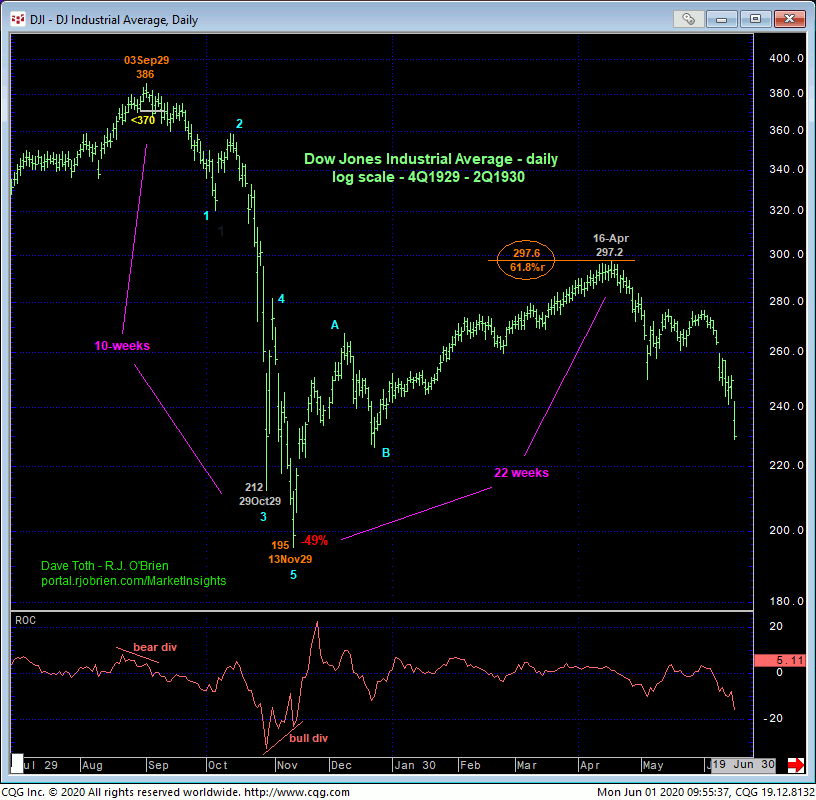
Moving out to a daily log scale chart above, the market remains in the bull trend recovery dating from 23-Mar’s 2174 low following 25-Mar’s bullish divergence in momentum discussed in that day’s Technical Blog. Given the extent and 5-wave impulsive nature of Feb-Mar’s collapse that broke the secular bull trend, we stated at the time and maintain that the expected extensive recovery cannot be ignored as a mere (B- or 2nd-Wave) correction within a massive peak/reversal-threat environment that arguably rivals some of the great reversal of all time, including the peak/reversal process from 03Sep1929 until 16Apr1930 shown in the daily log scale chart of the DJIA below.
What many forget is that after the infamous Black Tuesday on 29Oct29, the massive peak/reversal process included an extensive 61.8% retracement of Sep-Nov’29’s 10-week meltdown that spanned more than TWICE the initial break’s time (22 weeks). Such a protracted but corrective recovery may have soothed much of the previous carnage and fear, before the REAL debacle took hold.
Feb-Mar’20’s collapse spanned five weeks. This week is the 10th week of recovery with the market having retraced 76.4% of Feb-Mar’s 3398 – 2174 decline. But the only numbers and levels that matter now are, obviously, 20-Feb’s 3398 all-time high and the recent corrective lows and risk parameters cited above. IF we’re supposed to remain bullish “up here” (and for now, we are because the trend is up), it’s imperative for the bull to continue to behave like one and prove itself with sustained, trendy, impulsive behavior higher; specifically above levels like 2965, 2903 and especially 2760. Until the market recoups 3398 however, it would be foolish to ignore a peak/reversal-threat process that, like the spring of 1930, may be massive in scope.
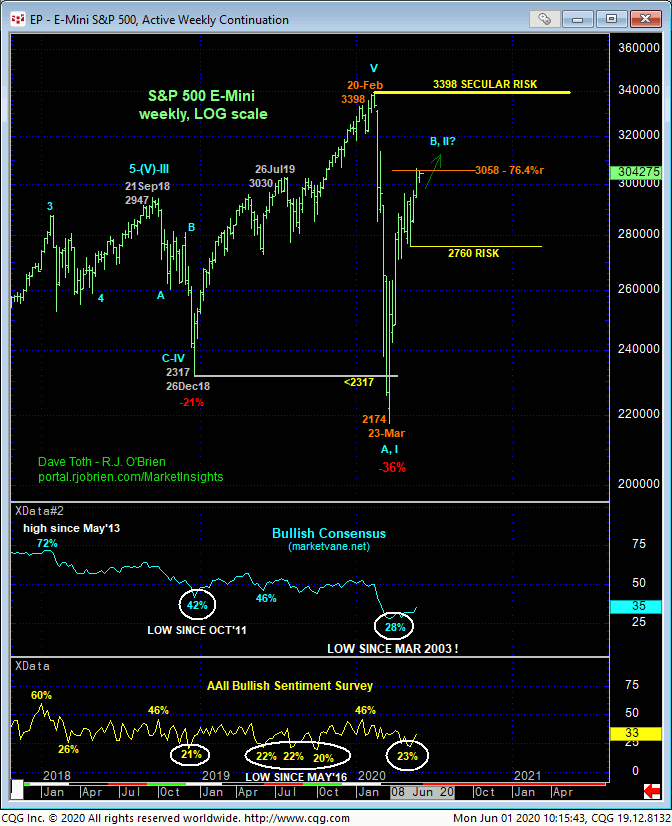
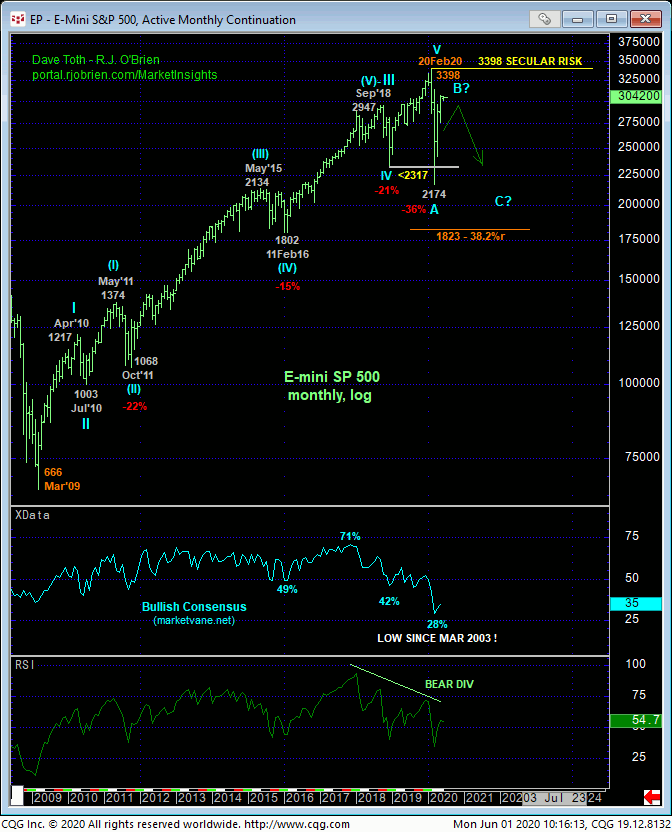
The weekly (above) and monthly (below) log scale charts show the clear break of the secular bull trend that defines 20-Feb’s 3398 high as THE high and secular risk parameter this market is now required to recoup to mitigate this major peak/reversal threat, reinstate the secular bull trend and expose potentially huge gains thereafter. Given the market’s encroachment on the upper-quarter of this year’s range, the market is tightening the screws on the range for the bull to “perform”.
These issues considered, the exact same technical discipline that applied to the weeks and even days leading up to 20-Feb’s all-time high applies again now since the trend is clearly up, warranting a bullish policy and exposure. To SUSTAIN this tack and policy however, it is imperative that the market maintain gains above at least 2965, preferably above 2903, and certainly above 2760. Failures below these levels, like in late-Feb, will increasingly threaten and then negate a bullish count and could expose another bear trend that could be worse than we experienced earlier this year. Until and unless such weakness is shown, further and possibly accelerated gains should not surprise.
