Posted on Jan 11, 2023, 02:02 by Dave Toth
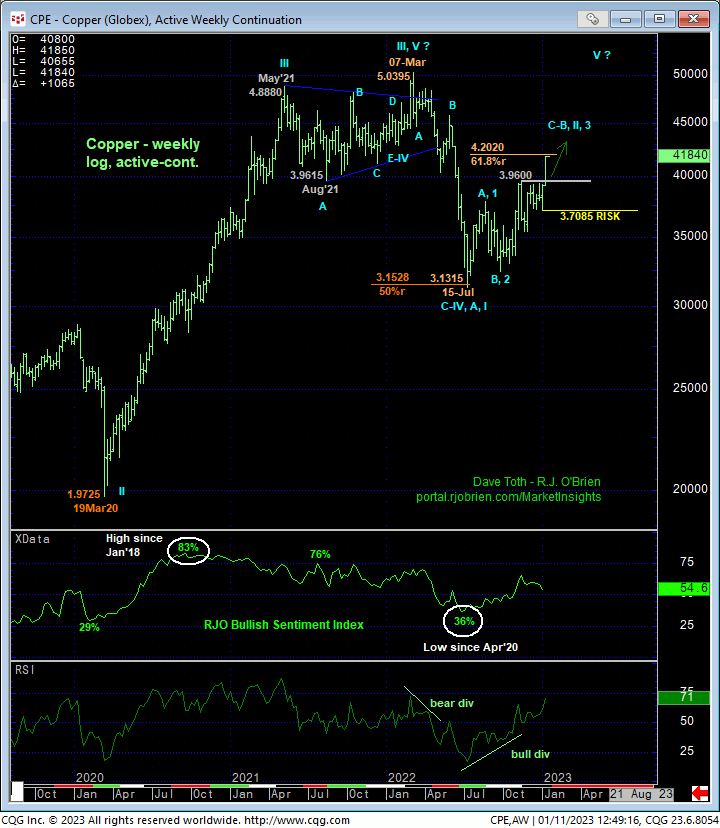
Since last Apr’s bearish divergence in weekly momentum amidst historically bullish sentiment/contrary opinion levels and an arguably complete long-term Elliott Wave sequence, we’ve approached this market from a new and long-term bearish perspective. The sheer extent of Mar-Jul’s $1.90, 38% decline would seem to reinforce a major peak/reversal environment. And indeed, by thus far retracing 61.8% of last year’s 5.0395 – 3.1315 decline on a weekly log active-continuation basis below, the past six months’ recovery remains well within the bounds of a (B- or 2nd-wave) correction within a multi-quarter peak/reversal process.
However, the extent of this increasingly impressive and impulsive recovery is now too great to consider it the 4-Wave of a 5-wave sequence down from last year’s high. Per such, the recovery from 15-Jul’s 3.1315 low is EITHER the broader B- or 2nd-Wave correction of last year’s 5.0395 – 3.1315 (A- or 1st-Wave) decline OR the massive (5th-Wave) resumption of the secular bull market to one more round of highs above 5.0395. IF the former, peak/reversal count is what the market has in mind, then somewhere between spot and 5.0395 this market MUST arrest the clear and present uptrend with a countering bearish divergence in momentum, perhaps around the (4.2020) 61.8% retrace of last year’s meltdown. IF, alternatively, the secular bull trend is resuming and this market is on a tack for 5.0395+ levels, then it is likely to rally in a sustained, trendy, impulsive manner, or precisely how it has behaved over the past week.

What has become compelling about a resumption of the secular bull market following the extent of the past week’s breakout above the past month-and-a-half’s 3.9600-area resistance is that:
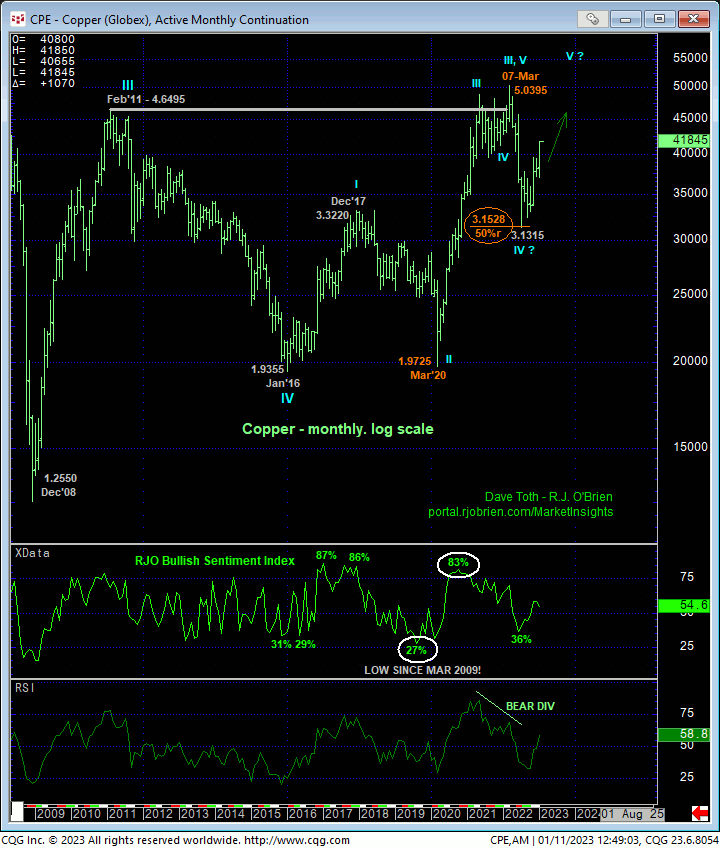
- this rally stems from the immediate area of the (3.1528) 50% retrace of Mar’20 – Mar’22’s entire 1.9725 – 5.0395 rally on a monthly log scale above and
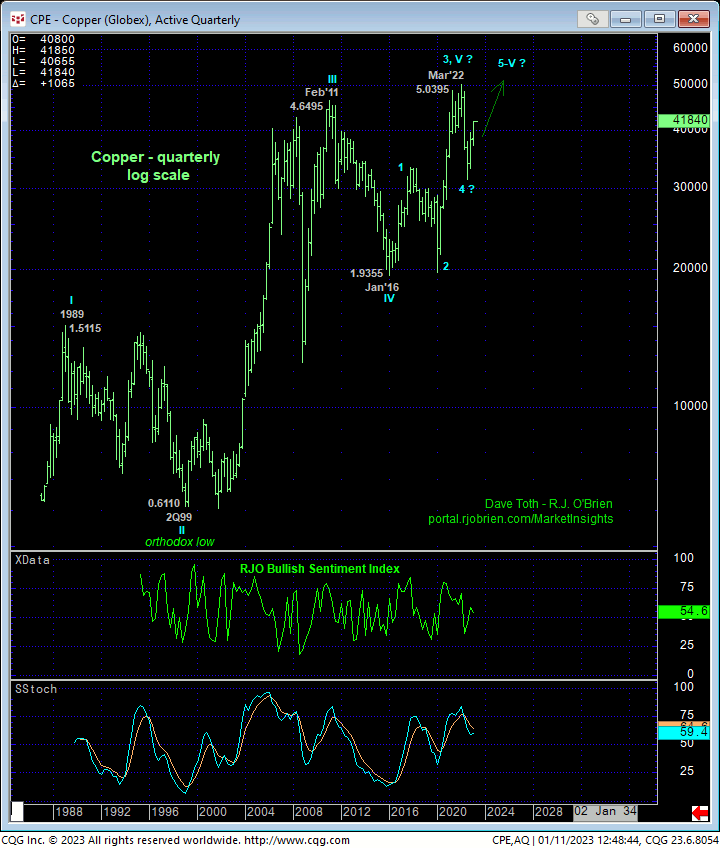
- Mar-Jul’22’s “meltdown” on a weekly scale looks to fall within the bounds of a mere 4th-Wave correction within a 5-wave sequence UP from Jan’16’s 1.9355 low on a quarterly log scale basis below.


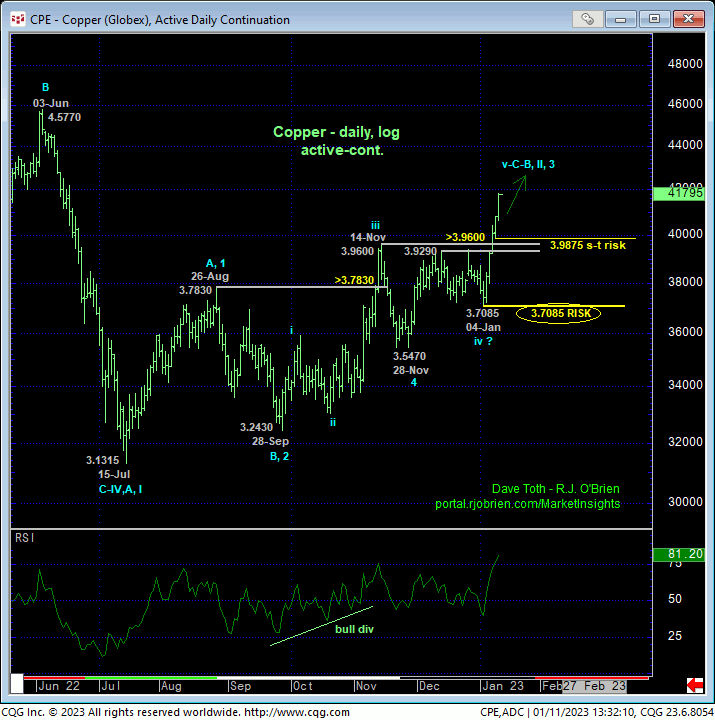
Drilling down to a more practical daily scale above and 240-min chart below these charts show this week’s impulsive obliteration of the 3.9600-area that capped this market has resistance for the past month-and-a-half. The important by-product of this bust out is the market’s clear definition of 04-Jan’s 3.7085 low as the latest larger-degree corrective low this market MUST stay above in order to maintain a long-term bullish count. A failure below 3.7085 would:
- confirm a bearish divergence in daily momentum
- break the uptrend from at least 28-Sep’s 3.2430 low
- expose the broader rally from Jul’s 3.1315 low as a 3-wave and thus corrective affair, and
- threaten the alternate and major bullish count and resurrect the massive peak/reversal process.
Per such, last week’s 3.7085 low serves as our new key long-term bull risk parameter. Former 3.96-to-3.92-area resistance would be expected to hold as new near-term support per any long-term bullish count.
On an even shorter-term basis, the 240-min chart below details the sub-division of the past week’s rally from 3.7085 where the past couple days’ impressive, impulsive continuation of the uptrend leaves Mon’s 3.9875 low in its wake as the latest smaller-degree corrective high the market is now minimally required to fail below to chalk up the rally from 3.7085 as a complete 5-wave Elliott sequence and expose at least an interim correction of the past week’s portion of the bull. Per such, this 3.9875 level serves as our new short-term risk parameter pertinent to shorter-term traders with tighter risk profiles.
These issues considered, at least a cautious bullish policy and exposure are advised with a failure below 3.9875 required for shorter-term traders to move to the sidelines and commensurately larger-degree weakness below 3.7085 for longer-term commercial players to follow suit. In lieu of such weakness, the trend is up on all scales and should not surprise by its continuance or acceleration straight away.


