by Dave Toth
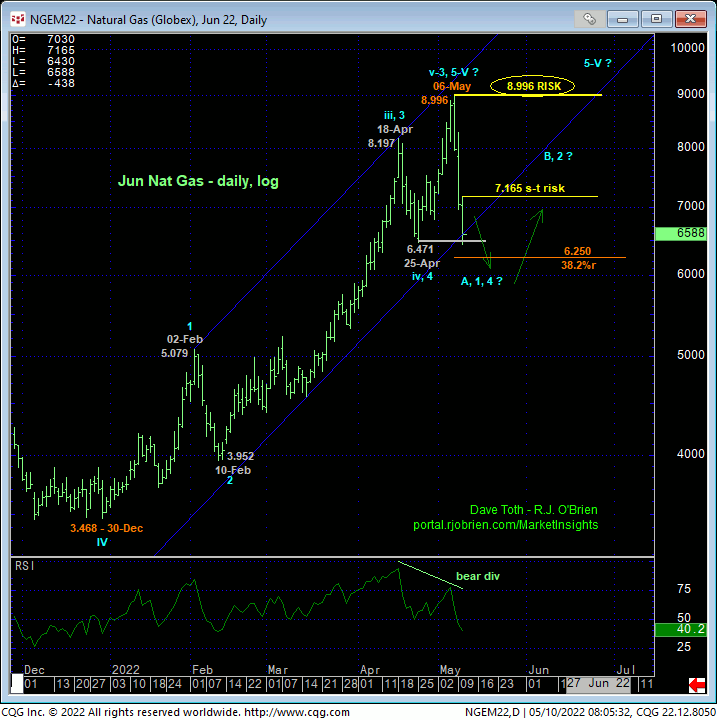
In yesterday’s Technical Webcast we discussed the market’s failure below 27-Apr’s 7.524 high and our short-term risk parameter that jeopardized the impulsive integrity of the portion of the bull trend from 25-Apr’s 6.471 low. With today’s continued plunge below 25-Apr’s 6.471 larger-degree corrective low and key risk parameter, the market has confirmed a bearish divergence in DAILY momentum. This larger-degree momentum failure marks Fri’s 8.996 high as one of developing importance and our new key long-term risk parameter from which longer-term commercial players can objectively base non-bullish decisions like long-covers.
From an Elliott Wave perspective, we’re acting on the premise that we don’t know whether Fri’s 8.996 high completed five waves up from 30Dec21’s 3.468 low or only three. Given the magnitude of the secular bull trend, we’ve got to be respectful of the still-bullish count that would contend this week’s relapse is just part of a 4th-Wave correction within the still-unfolding secular bull market. But it must also be acknowledged that that 8.996 high COULD have completed five waves from the Dec low that would end the secular bull trend.
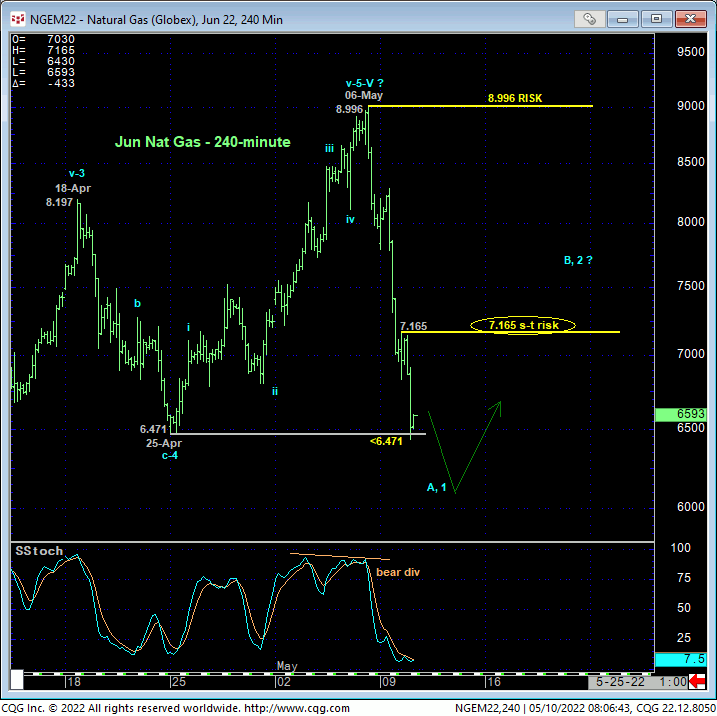
The FACT that the market as confirmed a bearish divergence in momentum satisfies the first of our three key reversal requirements. And when we look at the intra-day 240-min chart below, the current break from last week’s high is clearly a trendy, impulsive 5-wave affair. This satisfies the second of our three reversal requirements. The key third requirement of proof of 3-wave corrective behavior on a fully expected recovery attempt addresses the critical question of whether the bull is done or still kickin’.
IF last week’s 8.996 high completed 5-wave up and the long-term bull, then by definition, rebuttals to this week’s swoon would be expected to unfold in a 3-wave and thus corrective structure that does not eclipse the high. The forces that have driven this mega-bull are not going to evaporate easily or quickly, but rather over time and with potentially extensive corrective rebounds part of the broader peak/reversal PROCESS. If/when the market provides evidence of such a 3-wave recovery that could easily retrace more than 61.8% of the initial decline in the weeks ahead, AND a recovery that is stemmed by a countering bearish divergence in momentum, the risk/reward metrics of a new bearish policy could be extraordinary. Until these conditions are met, it would be premature to conclude the bull’s end. This said and as a result of today’s larger-degree momentum failure below 6.471, longer-term commercial players have been advised to move to a neutral/sideline position.
From a shorter-term perspective, the 240-min chart below shows the trendy, impulsive nature of the past few days’ decline that’s an important component and requirement of any broader bearish count. If the market has topped and the new longer-term trend is down, we would expect such trendy, impulsive behavior to characterize swimming WITH the stream.
This chart also shows today’s 7.165 high as a smaller-degree corrective high within this decline. A recovery above 7.165 would break this decline and expose at least that bigger (B- or 2nd-Wave) corrective rebuttal discussed above OR the (5thh-Wave) resumption of the secular bull. Per such, this 7.165 level is considered our new short-term risk parameter from which shorter-term traders with tighter risk profiles can objectively rebase and manage non-bullish decisions like long-covers and cautious bearish punts.
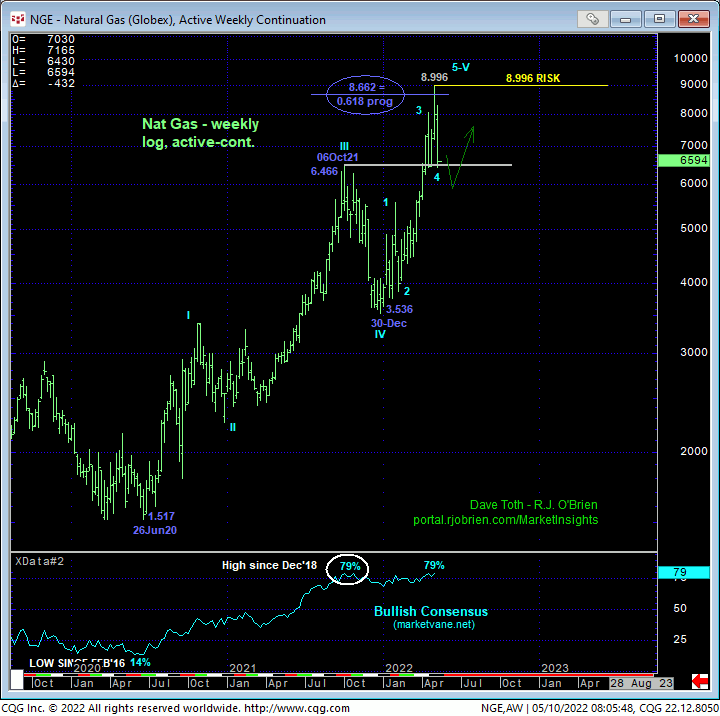
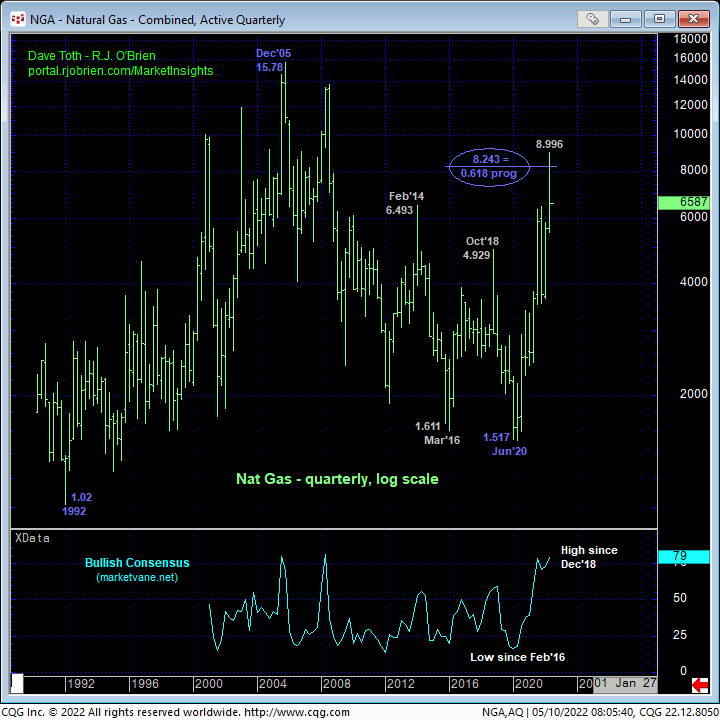
It is from a much longer-term perspective shown in the weekly (above) and monthly (below) log scale charts where the prospect that the secular bull trend has ended is compelling. Above, we discussed the prospect that the rally from Dec’21’s 3.536 low might be a compete 5-wave Elliott sequence. In the weekly chart above, this entire rally from 3.536 is arguably the completing 5th-wave of a massive sequence that dates from Jun’20’s 1.517 low. the Fibonacci fact that the rally from 3.536 came within 33-cents of the (8.662) 0.618 progression of the net distance of Waves-1-thru-3 (1.517 – 6.466) would seem to reinforce this count.
It is also notable that the rally from Jun’20’s 1.517 low came within 75-cents of the (8.243) 0.618 progression of the 1992 – 2005 preceding secular bull trend from 1.02 to 15.78 on a monthly log scale basis below. With the Bullish Consensus (marketvane.net) at a historically extreme 79% reading that the market last experienced during Oct’21’s top and major correction and in Dec’18 prior to that, sentiment/contrary opinion is certainly a contributing element to a peak/reversal threat that could be major in scope.
These issues considered and as a direct result of today’s bearish divergence in daily momentum, the elements typical of a major peak/reversal threat are in place. And the market has weakened enough to question the risk/reward merits of a continued bullish policy and exposure, so commercial players have been advised to move to a neutral/sideline position in order to circumvent the depths unknown of a larger-degree correction or major reversal lower. This said, the market has yet to satisfy the key third of our three reversal requirements: proof of 3-wave corrective behavior on a recovery attempt that could be extensive in terms of both price and time in the weeks ahead. Indeed, the next favorable risk/reward spec/punt could be from the bull side for either a bigger corrective rebound or resumption of the secular bull. But the market needs to recoup today’s 7.165 high to expose such. In sum, a neutral/sideline position is advised for the time being. But stay tuned because this is growing into a very, very interesting and opportunistic affair that could have long-term implications.