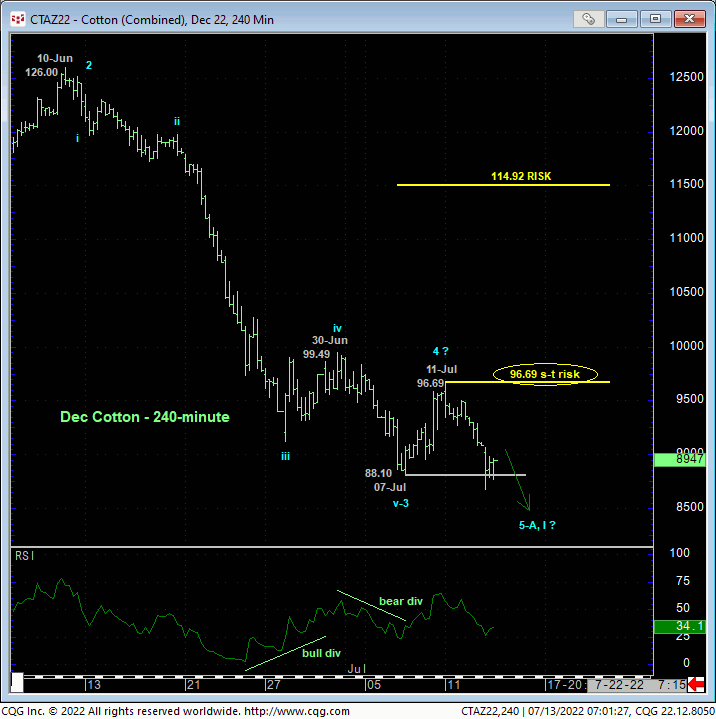
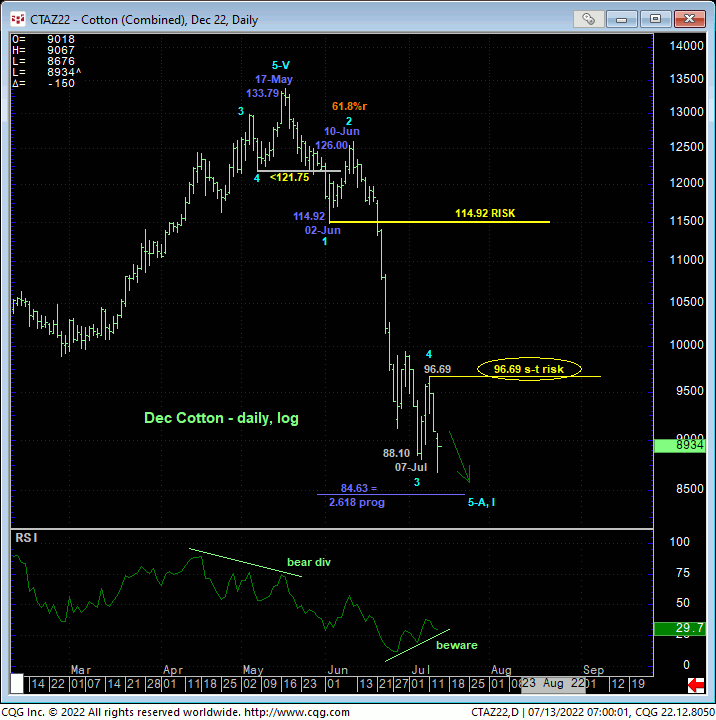
Overnight’s break below last week’s 88.10 low reaffirms our major peak/reversal count resurrected by 21-Jun’s break below 02-Jun’s 114.92 low discussed in 22-Jun’s Technical Blog. This continued meltdown leaves Mon’s 96.69 high in its wake as the latest smaller-degree corrective high the market is now required to sustain losses below to maintain a more immediate bearish count. Its failure to do so will confirm a bullish divergence in daily momentum and likely defined the END of a textbook 5-wave Elliott sequence down from 17-May’s 133.79 high in the Dec contract as labeled in the daily log chart below. Until and unless such strength is shown, the trend remains down on all scales and should not surprise by its continuance. Per such, we’re defining 96.69 as our new short-term but key risk parameter from which both short- and long-term traders can objectively rebase and manage the risk of a still-advised bearish policy and exposure.
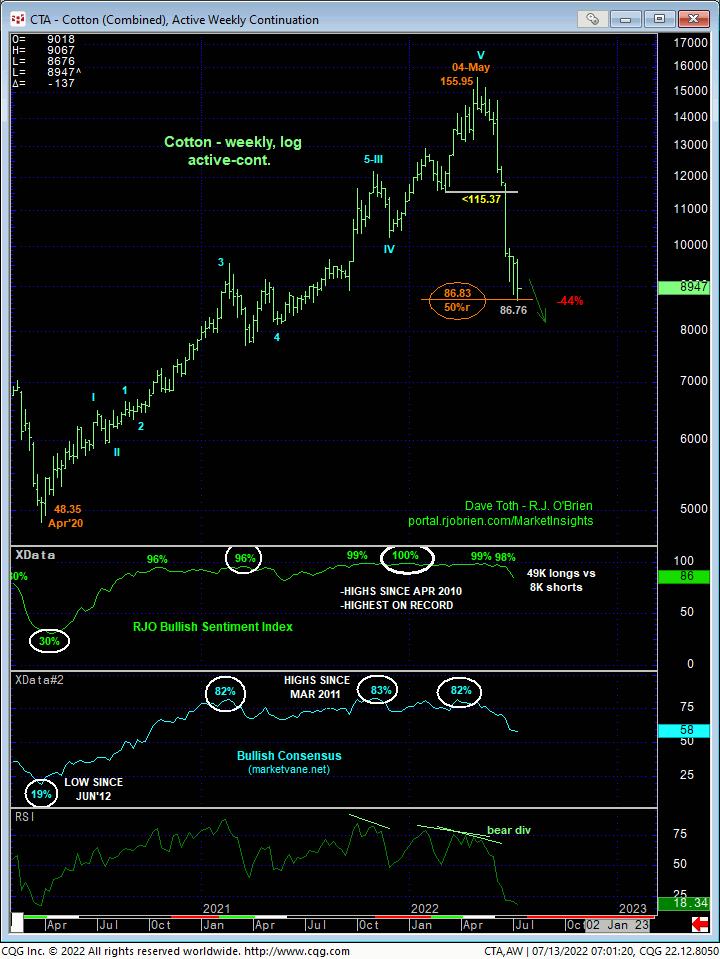
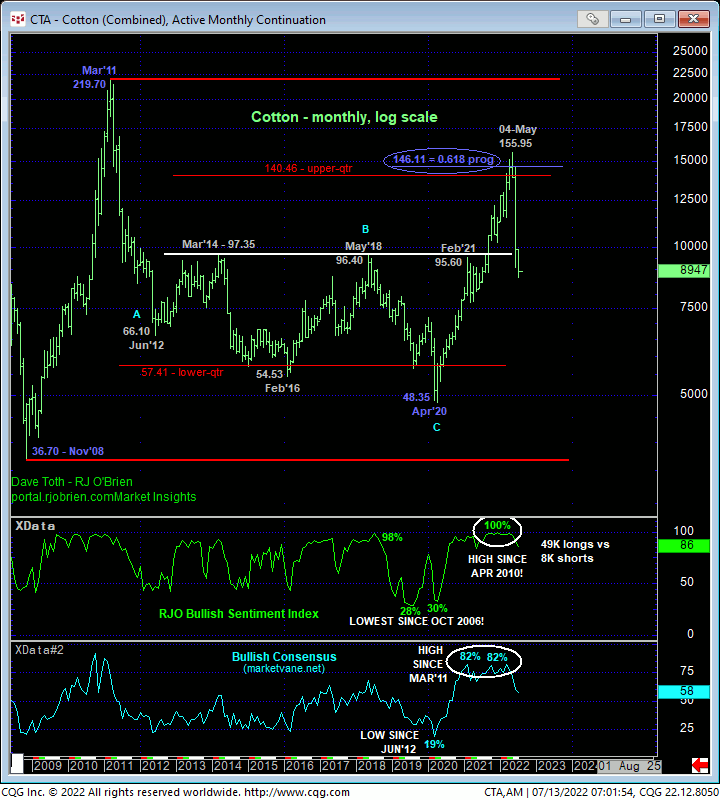
On a long-term basis, the weekly (above) and monthly (below) log scale charts show the technical elements that are typical of major peak/reversal environments and that warned of the current reversal:
- bearish divergences in both daily and weekly momentum amidst
- historically stratospheric sentiment/contrary opinion levels
- a complete and massive 5-wave Elliott sequence from Apr’20’s 48.35 low and
- the market’s rejection of the upper-quarter of its historical range.
Now, the market has very quickly retraced exactly 50% of the 2-YEAR secular bull market from 48.35 to 155.95 and is back deep within the middle-half bowels of its historical range that dates from 2008 where the odds of aimless whipsaw risk are approached as higher, warranting a more conservative approach to risk assumption. Herein lies the importance of a tighter but objective bear risk parameter like 96.69. Until and unless this market recovers above a corrective high like 96.69 however, the trend is down and should not surprise by its continuance.
One of the key contributing factors to our major peak/reversal count was the stratospheric extent to which the Managed Money community had its neck sticking out on the bull side. After the market finally broke the major uptrend with bearish divergences in momentum, initially on 26-May below 121.75 and subsequently on 21-Jun below 114.92, this grotesque long-&-wrong exposure became vulnerable to exactly the type of forced capitulation by the overall market that unfolded the third week of Jun and is likely still unfolding. We should see sharply lower RJO BSI levels when this indicator is updated this Fri afternoon. But this contrary opinion indicator, along with momentum, has done its job with respect to warning of a major top.
The challenge will be navigating a B- or 2nd-Wave corrective rebuttal to May-Jul’s collapse that could be extensive in terms of both price and time. And we will gauge such a rebound precisely around Mon’s 96.69 corrective high and key risk parameter. In lieu of such strength, the trend remains down and must be expected to continue, so a bearish policy and exposure remain advised with a recovery above 96.69 required to warrant taking profits and moving to a neutral/sideline position initially.