Posted on Jan 13, 2023, 08:38 by Dave Toth
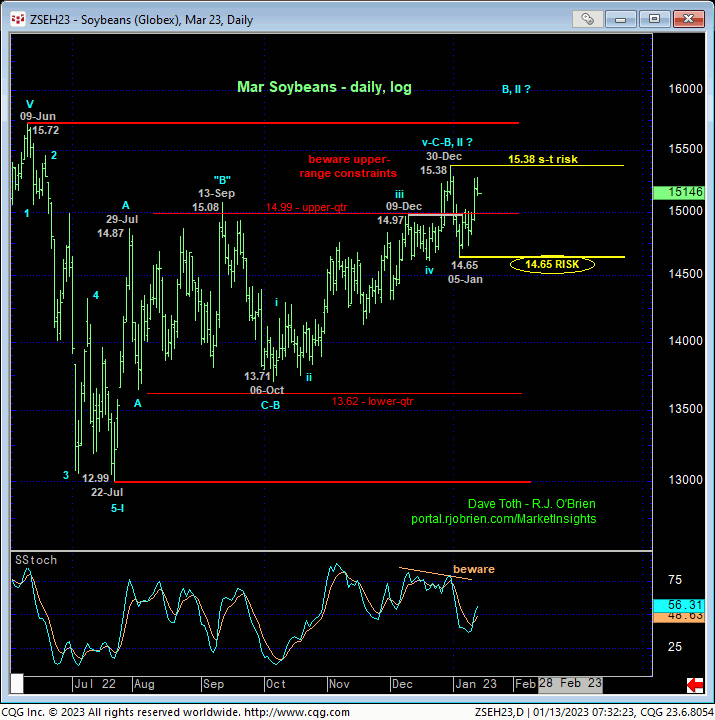
Yesterday’s break above Mon’s 14.99 initial counter-trend high confirms a bullish divergence in short-term momentum. This recovery confirms 05-Jan’s 14.65 low as the END of the decline from 30-Dec’s 15.38 high and THE level this market now needs to break from a longer-term perspective to render it an initial counter-trend low and confirm a bearish divergence in DAILY momentum that would reinforce a broader peak/reversal threat. Per such, we’re identifying this 14.65 level as our new long-term bull risk parameter pertinent to longer-term commercial players. Until and unless this market fails below 14.65, the longer-term recovery attempt from last Jul’s 12.99 low remains intact and should not surprise by its continuance.
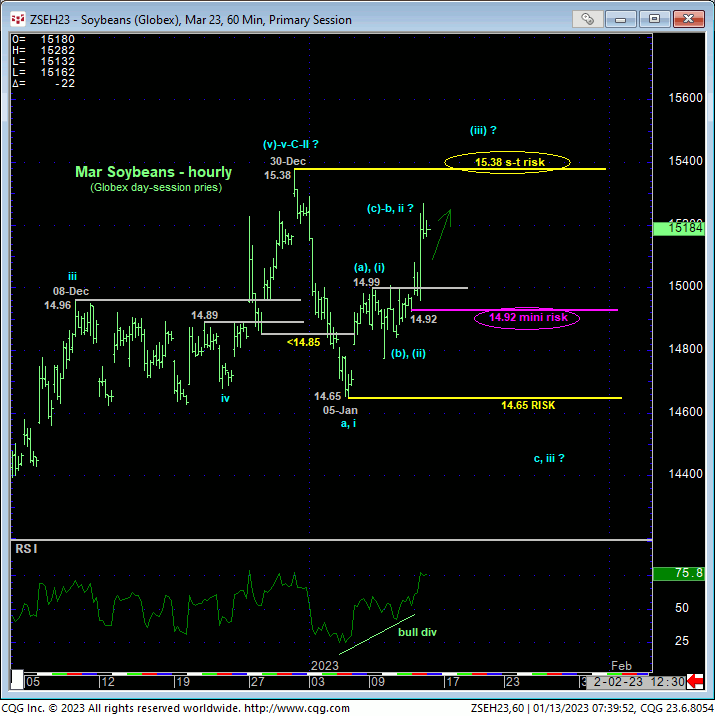
From a shorter-term perspective and as a direct result of yesterday’s impulsive spike above 14.99, the hourly chart below also shows a smaller-degree corrective low at 14.92 from Wed afternoon. IF the recovery from last week’s 14.65 low is NOT a correction but rather the resumption of the 6-month recovery, the market would fully be expected to not only sustain trendy, impulsive gains above 14.92, but also to blow away 30-Dec’s 15.38 high. Per such, we’re identifying 14.92 as an intra-range mini risk parameter from which short-term traders can objectively base non-bearish decisions like short-covers and bullish punts. While that 15.38 high remains intact as resistance however, it would be premature to ignore this level as continued resistance ahead of further lateral-to-lower price action in the weeks ahead. Per such, 15.38 remains intact as an objective parameter from which non-bullish decisions like long-covers and cautious bearish punts can also be objectively based and managed by shorter-term traders.
In effect, we believe this market has identified 15.38, 14.92 and especially 14.65 as the key directional flexion points headed forward. Traders are advised to toggle directional biases and exposure around these levels commensurate with their own personal risk profiles.
As recently discussed, the combination of:
- the Mar contract’s proximity to the upper-quarter of the past year’s range
- waning upside momentum, and
- still-historically extreme levels in our RJO Bullish Sentiment Index (RJO BSI)
continues to present a precarious situation for bulls. The market has yet to confirm a bearish divergence in DAILY momentum needed to break the uptrend from at least 06-Oct’s 13.71 low and reinforce a major peak/reversal count. Herein lies the critical importance of 05-Jan’s 14.65 low and key long-term bull risk parameter. Last week’s bearish divergence in SHORT-TERM momentum was sufficient to identify 30-Dec’s 15.38 high as one of developing importance per this broader peak/reversal-threat environment, but this mo failure was and remains of an INsufficient scale to CONCLUDE broader top. And it’s easy to see that a recovery above 15.38 will nullify that bearish divergence in short-term mo and reinstate the 6-MONTH uptrend. How the bull behaves above 15.38 is anyone’s guess, but the market’s upside potential above 165.38 is advised to approached as indeterminable and potentially severe until/until stemmed by a countering bearish divergence in momentum.
As far as the extraordinary levels in our RJO BSI that are typical of major PEAK/reversal environments, we would remind traders that sentiment/contrary opinion is not an applicable technical tool in the absence of an accompanying confirmed bearish divergence in momentum of a scale sufficient to threaten the broader trend. Again, herein lies the importance of 05-Jan’s 14.65 low as a critical bull risk parameter around which longer-term commercial players are advised to toggle directional biases and exposure.
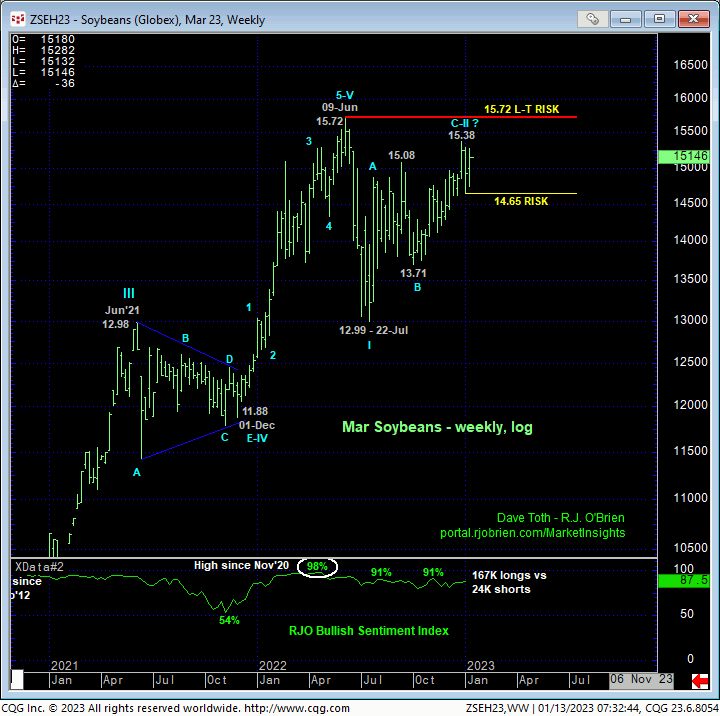
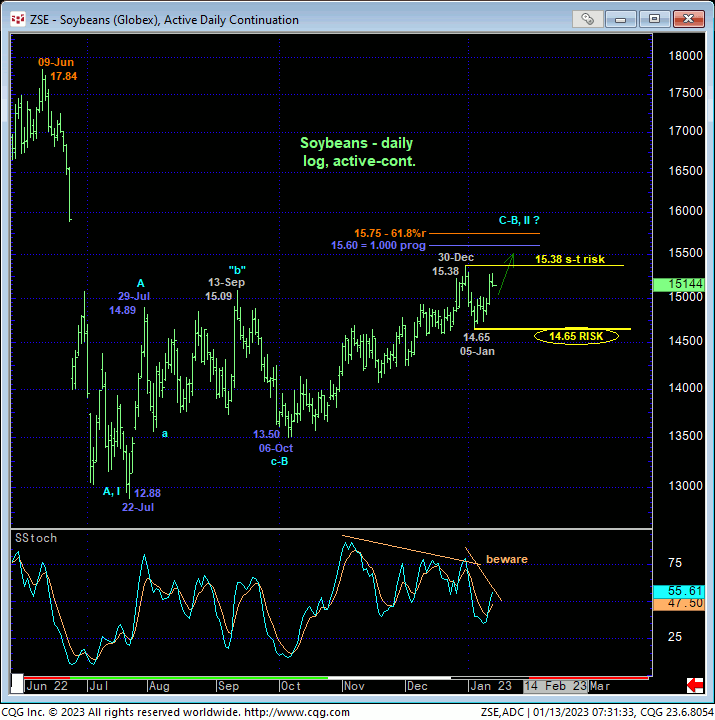
OK, so we know exactly what to do and expect on a failure below 14.65: commercial end-users can pare or neutralize bull hedges and producers can initiate new bear hedges. But planning ahead for a resumption of the uptrend above 15.38 that might lead to new highs above 09-Jun’s 15.72 range cap in the Mar contract warrants the consideration of this market on an active-continuation basis given that last summer’s high in the then-prompt Jul22 contract was 17.84. The daily (above) and weekly (below) log scale charts show the recovery from 22-Jul’s 12.88 low that remains well within the bounds of a mere (B- or 2nd-Wave) correction of Jun-Jul’22’s impulsive and (we believe) INITIAL (A- or 1st-Wave) of a massive peak/reversal process.
If the Mar contract takes out 30-Dec’s 15.38 high, the 6-month uptrend will be reinstated on this active-continuation basis. We have noted a pair of Fibonacci progression and retracement relationships at 15.60 and 15.75, respectively. These levels sandwich 09-Jun’s 15.72 high in the Mar contract. Per such, and while the market’s upside potential above is advised to approached as indeterminable and potentially extensive, the 15.60-to-15.75-area will be an interesting one to watch for the requisite development of a bearish divergence in momentum needed to even defer, let alone threaten the bull. Despite the interesting nature of this 15.60-to-15.75-area, this area is NOT considered resistance until and unless accompanied by a confirmed bearish divergence in momentum.
Again, the market’s upside potential above 15.38 should be considered indeterminable and potentially extreme, warranting continued bull hedges for commercial end-users. Conversely, commercial producers can defer bear hedges until the market fails below 14.65 OR from some (potentially considerably) higher level above 15.38 after a bearish divergence in momentum stems the uptrend.
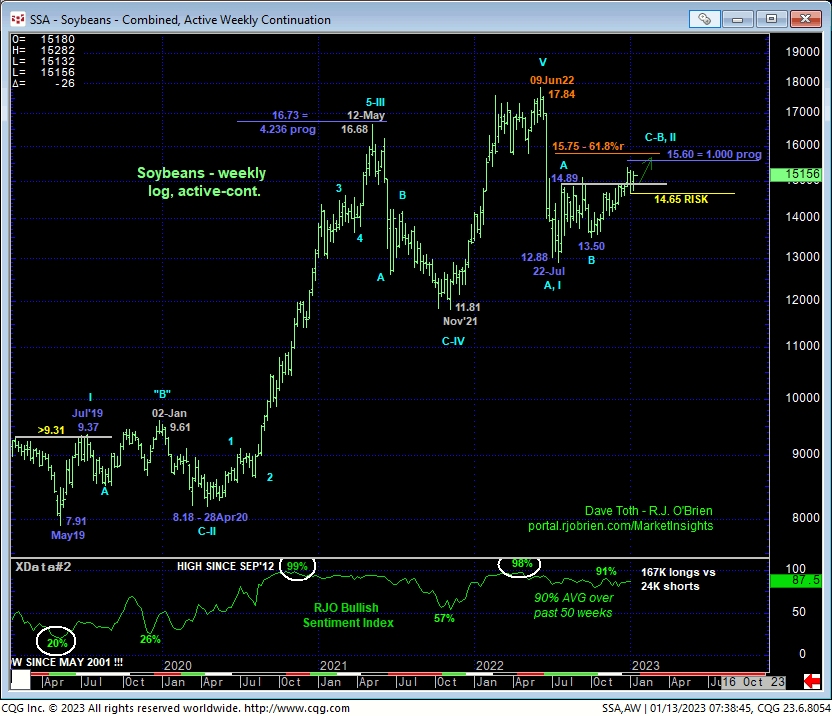
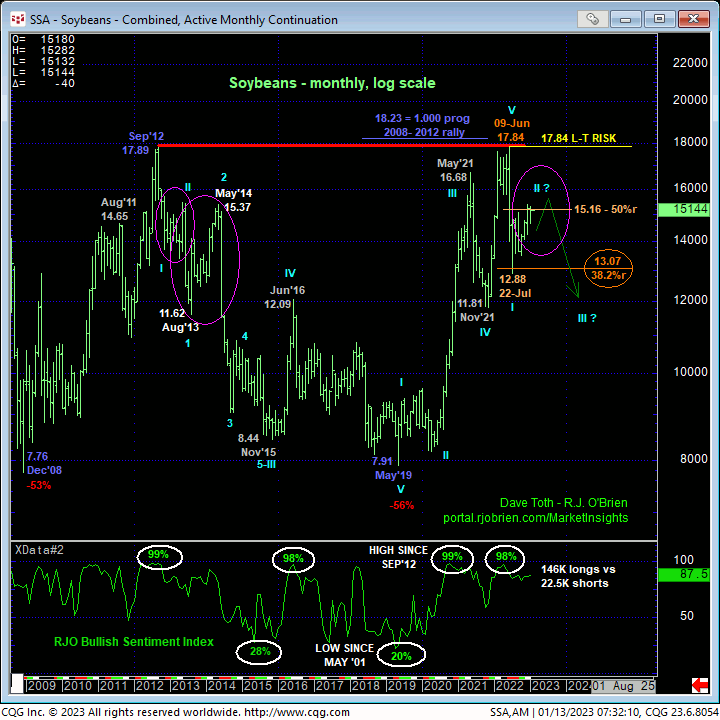
Finally, from an even longer-term monthly log active-continuation basis, the chart below shows what we believe is the same sort of major peak/reversal PROCESS that followed Sep’12’s 17.89 all-time high following:
- a bearish divergence in weekly momentum amidst
- historically extreme bullish sentiment and
- an arguably complete and massive 5-wave Elliott sequence from May’19’s 7.91 low.
Against this backdrop, any recovery attempt shy of last summer’s 17.84 high falls within the bounds of a major (B- or 2nd-Wave) correction. The challenge and consideration however is- just like in the months and QUARTERS that followed the initial sell-off from Sep’12’s high- the corrective rebuttal to the initial counter-trend decline can be extensive in terms of both price and time. Herein lies the rationale for not underestimating this market’s upside potential if/when it breaks above 15.38.
These issues considered, a bullish policy and exposure remain advised for longer-term commercial players with a relapse below 14.65 required to neutralize al exposure and reverse into a new bearish policy. Shorter-term traders with tighter risk profiles have the option of playing it either way for the time being, long with a failure below 14.92 required to negate this specific call and warrant its cover or short with a recovery above 15.38 required to negate this call, warrant its cover and reversal into a bullish stance.
