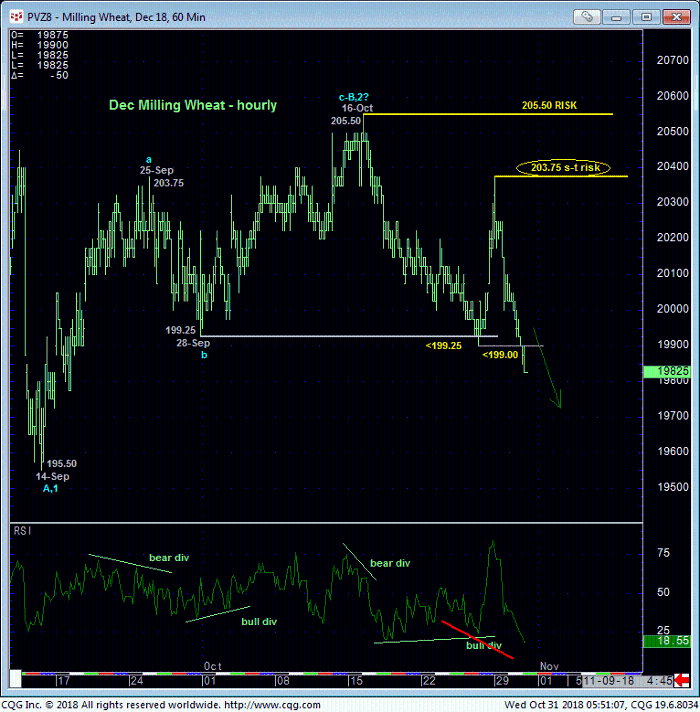
In 18-Oct’s Technical Blog we discussed the prior day’s slip below an admittedly smaller-degree corrective low at 202.00 as the prospective baby step of a peak/reversal count that identified 16-Oct’s 205.50 intra-day high as the end or upper boundary to a mere corrective/consolidative recovery attempt from 14-Sep’s 195.50 low. Two weeks on today’s clear break below 28-Sep’s 199.25 low reinforces the 3-wave and thus corrective appearance of that recovery attempt from 14-Sep’s 195.50 low to 16-Oct’s 205.50 high as labeled in the hourly chart below.
As a result of this continued, if intra-range weakness, the market has defined Mon’s 203.75 high and 16-Oct’s 205.50 high as recent smaller- and larger-degree corrective highs. This technical fact allows us to identify these levels as our new short- and longer-term risk parameters from which traders can objectively rebase and manage the risk of an advised bearish policy. Former 200.00-area support is expected to hold as new near-term resistance.


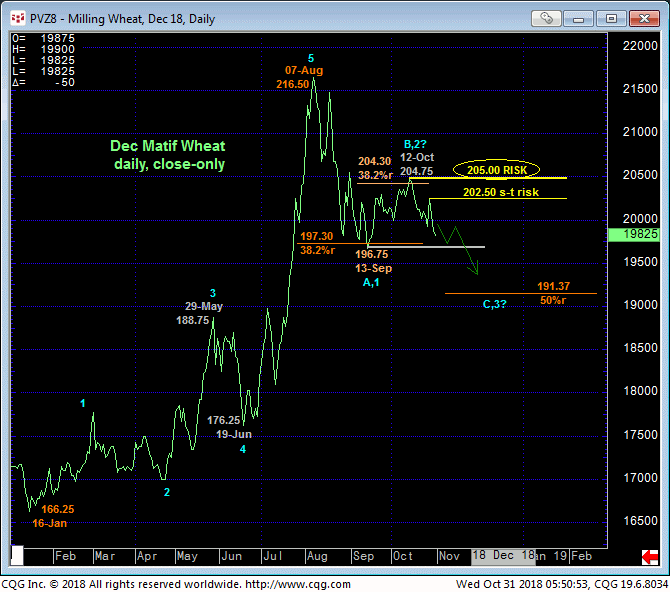
After an incredible run-up in Jul/Aug, factors are mounting that 07-Aug’s 216.50 high close COMPLETED the entire (5-wave) rally from 16-Jan’s 166.25 low close and that Aug-Sep’s impulsive decline to 13-Sep’s 196.75 low is just the initial (A- or 1st-Wave) of a larger-degree correction or reversal lower. The extraordinarily labored recovery attempt from that mid-Sep low that retraced only a Fibonacci minimum 38.2% of Aug-Sep’s plunge would seem to reinforce this bearish count.
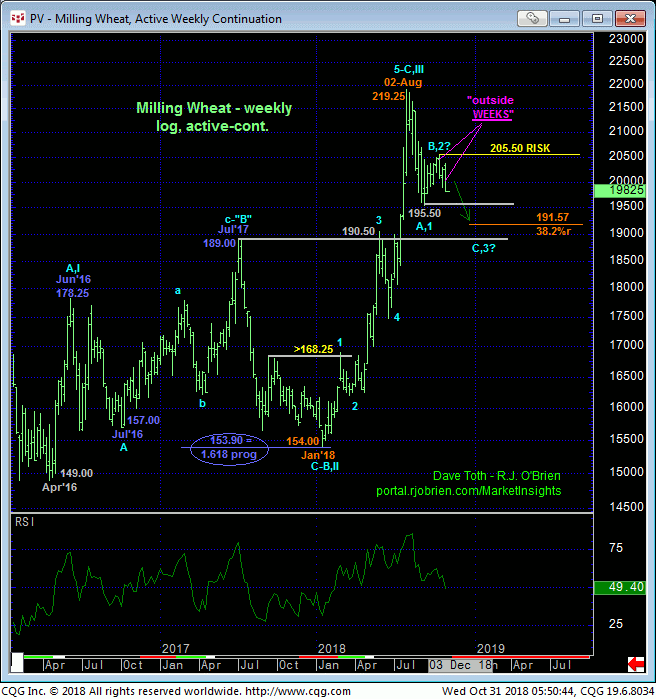
Additionally, on a weekly log active-continuation basis below, the market is working this week on its SECOND “outside week” (higher high, lower low and lower close than last week’s range and close) in the past three weeks. This is hardly encouraging price action for bulls.

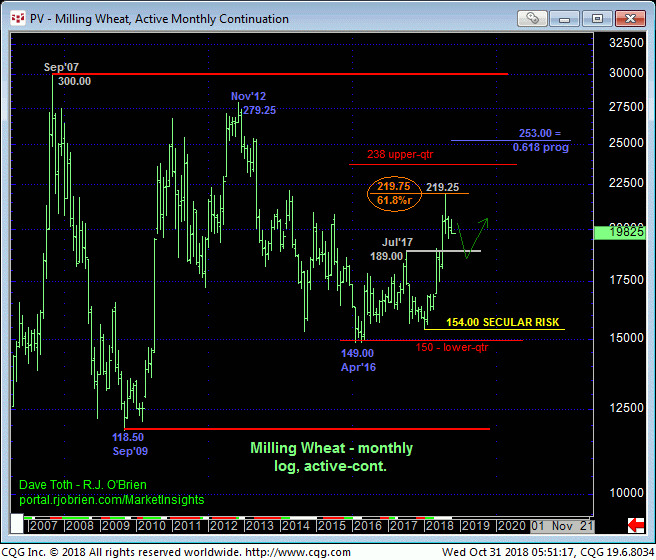
Lastly and as previously discussed, 02-Aug’s 219.25 intra-day high came within two measly ticks of the (219.75) 61.8% retrace of the last secular bear market from Nov’12’s 279.25 high to Apr’16’s 149.00 low. While this monthly chart also shows this market residing deep within the middle-half bowels of the past 11 YEARS’ range where massive whipsaw risk could easily dominate this market for quarters ahead, from a short-to-intermediate-term perspective we believe the technical facts cited above warn of a resumption of Aug-Sep’s decline to new lows below 195.50. And once below that key low, the market’s downside potential would have to be approached as indeterminable and potentially severe.
Key former resistance around the 189-handle would be a considered support candidate, but once the downtrend resumes the only real way to identify a more significant low and support would be after the market confirms a bullish divergence in momentum.
These issues considered and while allowing for the 195.50 lower boundary of the past month-and-a-half’s range to hold as support for a while, we anticipate an eventual break below 195.50 to subsequent unknown depths. Per such a bearish policy and exposure from 202.00 OB remains advised with a recovery above 202.50 minimally required to defer or threaten this call and warrant defensive action by shorter-term traders with tighter risk profiles. Commensurately larger=degree strength above 205.50 is required for long-term players to take defensive action.


