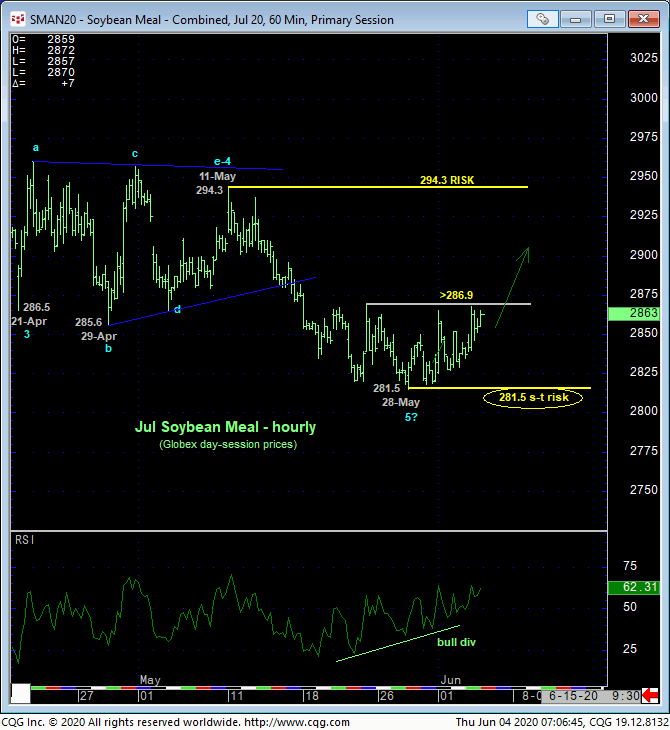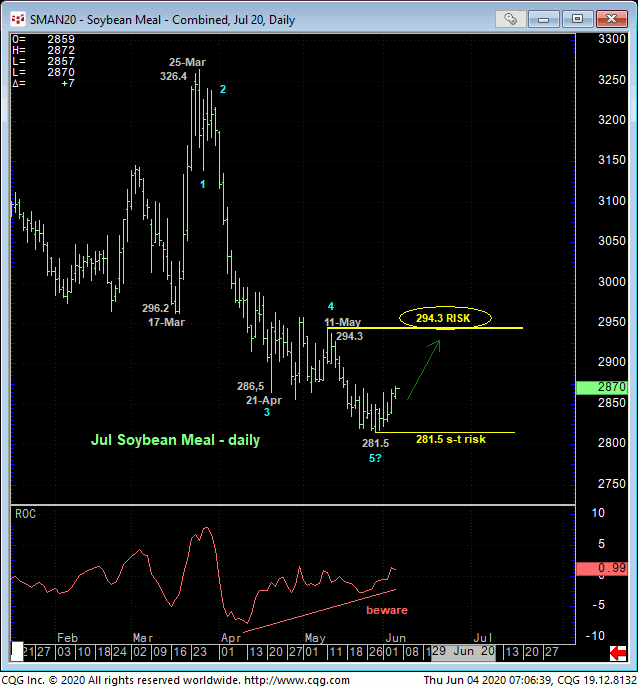

While the hourly chart of Globex day-session prices above does not yet reflect it, the daily chart below shows likely prices today above 22-May’s 286.9 smaller-degree corrective high. Such 286.9+ strength will confirm a bullish divergence in admittedly short-term momentum. Of course, such a smaller-degree mo failure is NOT of a sufficient scale to conclude a major base/reversal environment. It would only be sufficient to conclude the end of the decline from 11-May’s 294.3 next larger-degree corrective high and key long-term risk parameter. HOWEVER, such a minor mo failure would absolutely be sufficient to define 28-May’s 281.5 low as one of developing importance and quite an objective parameter from which to base non-bearish decisions like short-covers and cautious bullish punts. And given ancillary evidence of a longer-term base/reversal-threat environment, we believe the risk/reward merits of a bullish punt at-the-market is not only favorable, but could provide one of the great opportunities across all commodity sectors for the months ahead.
One bit of longer-term base/reversal-threat evidence is the developing prospect that the resumed slide from 11-May’s 294.3 high is the COMPLETING wave of a 5-wave Elliott sequence from 25-Mar’s 326.4 high as labeled in the daily chart below. Commensurately larger-degree strength above that 294.3 larger-degree corrective high and key bear risk parameter remains required to confirm this count and expose a base/reversal process that we believe could be major in scope. While longer-term players are still advised to use this 294.3 threshold as a key directional flexion point around which to reverse into a bullish policy, current shorter-term issues provide the first bit of evidence of improving odds for that 294.3+ eventuality, so be prepared with that reversal plan-of-action.


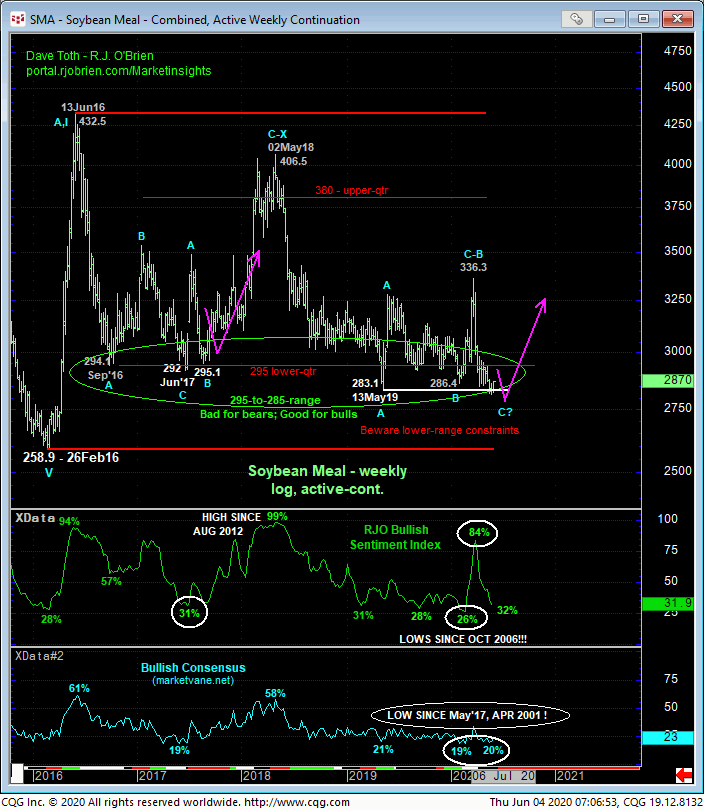
As discussed many, many times since Sep’16’s relapse into the lower-quarter of the past FOUR YEAR range defined by 2016’s 259 – 432-range shown in the weekly log active-continuation chart above, the risk/reward merits of maintaining a bearish policy “down here” are questionable at the very least, especially when accompanied by historically bearish levels of market sentiment/contrary opinion. Currently, the Bullish Consensus (marketvane.net) measure of sentiment remains at such historically low levels that haven’t been seen since 2006! And our proprietary RJO Bullish Sentiment Index has relapsed from Mar’s understandable lemming-led spike to 84% that warned of and contributed to Mar’s peak/reversal to a historically low level at 32%.
This said, traders are reminded that we do not consider sentiment an applicable technical tool in the absence of an accompanying confirmed bullish divergence in momentum of a scale sufficient to break or even threaten the major downtrend. Today’s presumed bullish divergence in mo above 286.9 does NOT satisfy this requirement. For those acting on such a longer-term scale, again, a recovery above 294.3 will most certainly do the trick. But whether you’re a short- or longer-term trader, it’s hard to ignore the risk/reward merits of at least some kind of bullish decision “down here”- a new bullish policy for shorter-term traders or pared bearish exposure by longer-term players- until the market negates this prospect with a failure below 281.5.
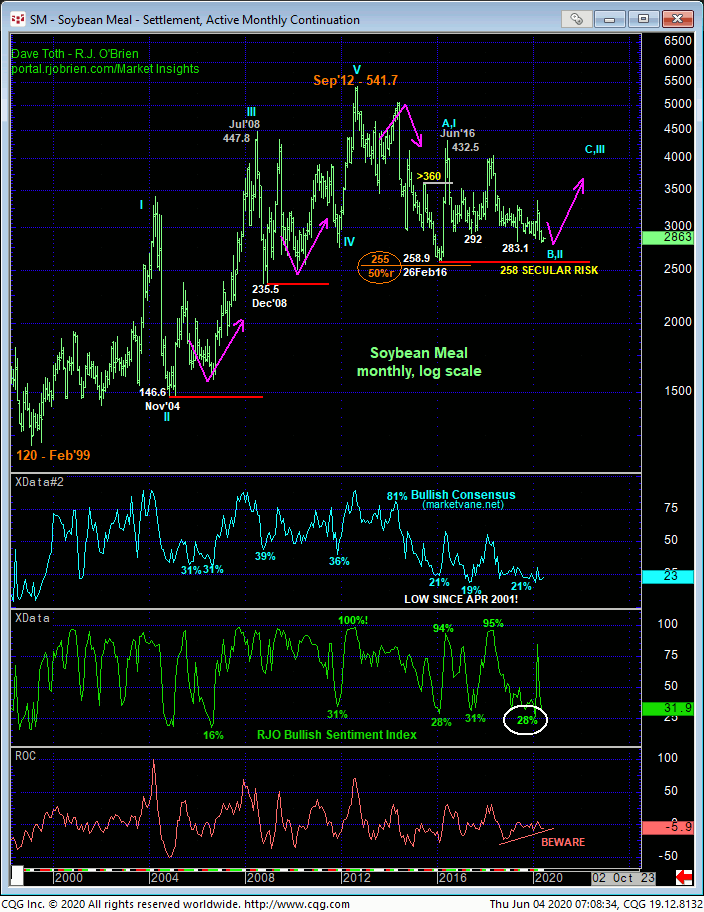
Lastly, the monthly log chart below shows this market’s history of severely retesting major flexion points as part of major reversal processes:
- Sep’06’s retest of Nov’04’s low that was never broken
- Mar’10’s retest of Dec’08’s low that was never broken
- May’14’s retest of Sep’12’s high that was never broken.
If the current severe retest of Feb’16’s 259 low follows suit, the risk/reward merits of a non-bearish decisions from current 287-area prices would be extraordinary.
These issues considered, traders are advised to move to a new bullish policy at-the-market (287.0 OB) with a relapse below 281.5 required to negate this call and warrant its immediate cover. In lieu of such sub-281.5 weakness, further gains are anticipated with 11-May’s 294.3 high the next pivotal upside flexion point. Above that level there would be no technical reason to be anything but long/bullish.


