Posted on Aug 09, 2022, 08:08 by Dave Toth
With 28-Jul’s bearish divergence in very short-term momentum below 8.345, we discussed in 01-Aug’s Technical Blog the market’s pending rejection of the extreme upper recesses of the past couple months’ range that would be expected within our major peak/reversal count. The 240-min chart below shows yesterday’s continued erosion below last week’s 7.550 initial counter-trend low that reinforces this broader peak/reversal count with the important by-product being the market’s definition of 03-Aug’s 8.480 high as the latest smaller-degree corrective high it is now minimally required to recover above to render the sell-off attempt from 26-Jul’s 9.419 high a 3-wave and thus corrective affair that might then re-expose not only Jul’s uptrend, but possibly the secular bull market. Until and unless this market recoups at least 8.480, there’s no way to know that the decline from that corrective high isn’t the dramatic 3rd-Wave down within a major peak/reversal process. Per such, we are defining 8.480 as our new short-term risk parameter from which an advised bearish policy and exposure can be objectively rebased and managed.


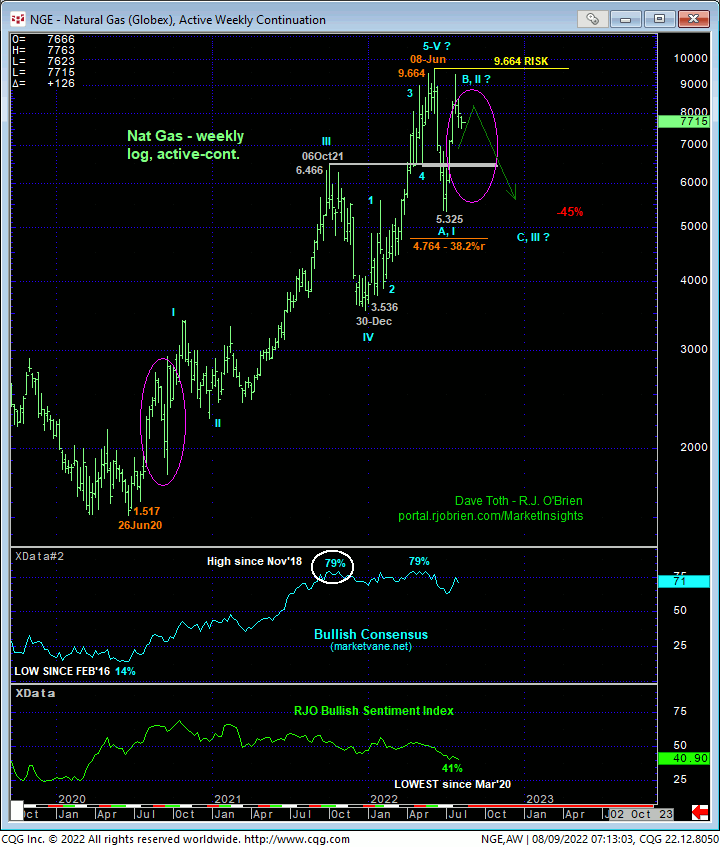
On a broader scale, traders must consider Jul’s not unimpressive recovery within the context of the price action that preceded it and the factors on which our major peak/reversal count is predicated:
- mid-Jun’s bearish divergence in WEEKLY momentum amidst
- historically extreme levels in the Bullish Consensus (marketvane.net) not see since those that warned of and accompanied Nov’18’s major top
- the prospect that 08-Jun’s 9.664 high completed a textbook and massive 5-wave Elliott sequence from Jun’20’s 1.517 low
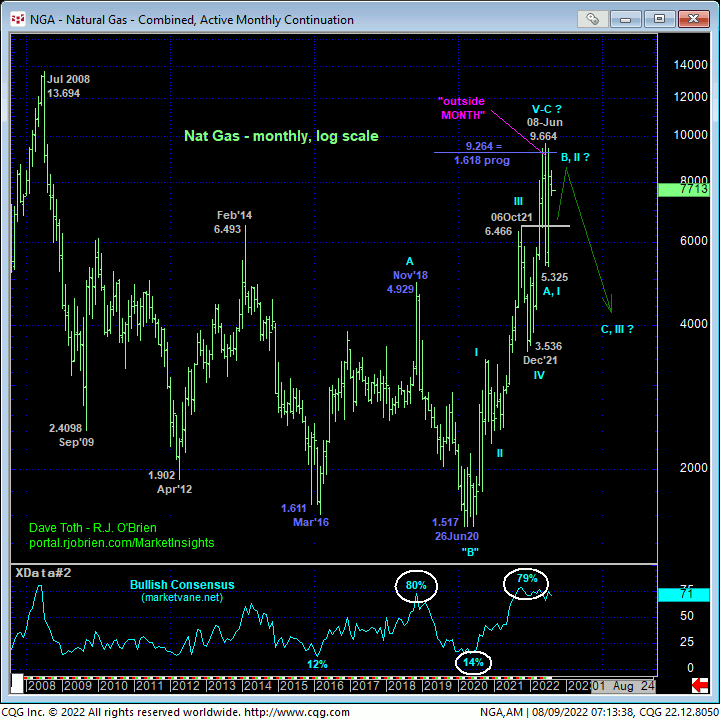
- the impulsive 5-wave sub-division of Jun-Jul’s INITIAL counter-trend decline, and, as we’ll show in the monthly log chart (bottom)
- Jun’s “outside MONTH down” (i.e. higher high, lower low and lower close than May’s range and close) the month of THE high.
Given these facts and observations, 08-Jun’s high- 9.664 on an active-continuation basis and 9.598 basis the Sep contract- are THE levels this market needs to recoup to negate this major peak/reversal count and reinstate the secular bull trend. Until and unless such strength is proven, even extensive recovery attempts like Jul’s fall within the bounds of corrective bear market rallies. Indeed and from an alternate base/reversal example, the second-half of 2020’s basing process included a similarly extensive corrective relapse. The past couple weeks’ clear rejection of the early-Jun high and resistance would seem to remain consistent with this peak/reversal count. And if this count is indeed correct, then the risk/reward merits of a bearish policy and exposure from “up here” are not only favorable, but possibly extraordinary.

On an even longer-term monthly basis, the log scale active-continuation chart below shows Jun’s “outside MONTH down” and the prospect that the entire 2020 – 2022 rally is a complete, textbook even, 5-wave Elliott sequence that came within 0.40-cents of the (9.264) 1.618 progression of 2016 – 2018’s previous bull trend from 1.611 to 4.929.
Given the magnitude of the 2-year secular bull trend, it remains premature to CONCLUDE a major reversal and that the market is in the early stages of a new bear market. Proof of trendy, impulsive, sustained losses in the weeks ahead would reinforce this count while a break below 05-Jul’s 5.324 low will confirm it. But it is NOT premature to identify recent highs and resistance at 8.480 and 9.598 as objective risk parameters from which to bias towards a bearish policy and exposure. Per such, traders remain advised to do so with a recovery above 8.480 required for shorter-term traders to move to the sidelines and commensurately larger-degree strength above 9.598 for longer-term commercial players to follow suit. In lieu of such strength, further and possibly accelerated losses should not surprise.


