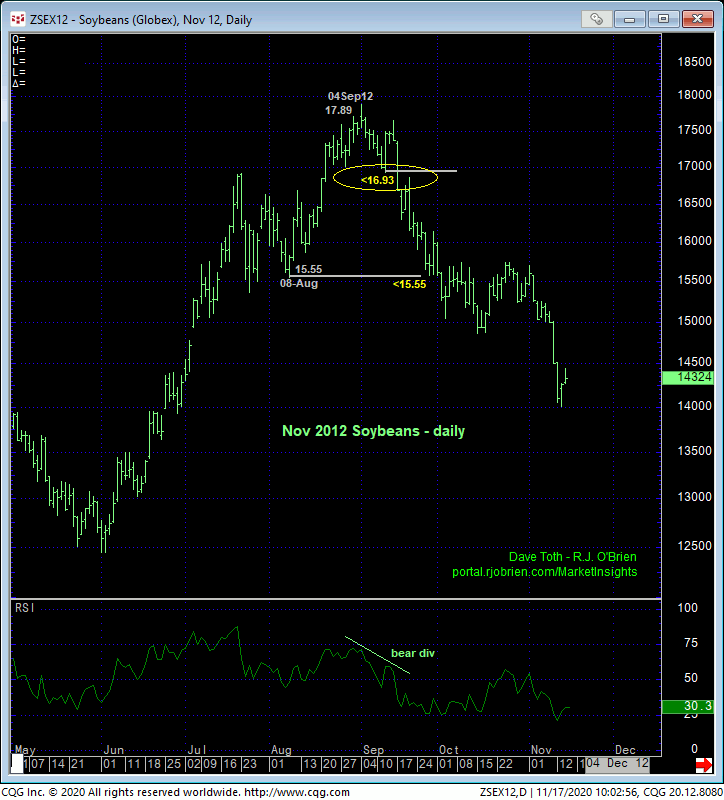
Today’s break above last week’s 11.59 high reaffirms thus year’s still-developing bull tend and our major base/reversal count introduced in 30-Apr’s Technical Blog. The important by-product of this continued strength is the market’s definition of Thur’s 11.39-3/4 low as the latest smaller-degree corrective low this market is now required to sustain gains above to maintain a more immediate bullish count. Its failure to do so will confirm a bearish divergence in short-term momentum, stem the bull and expose what would likely be just a slightly larger-degree correction within the major bull. But given the extent of early-Nov’s continued rally and degree to which the Managed Money has its neck sticking out on the bull side, even a relatively minor correction could be nominally steep. Per such, we’re identifying 11.39 as our new short-term risk parameter from which shorter-term traders can objectively rebase and manage the risk of a still-advised bullish policy.
Former 11.59/.57-area resistance would be expected to hold as new near-term support.
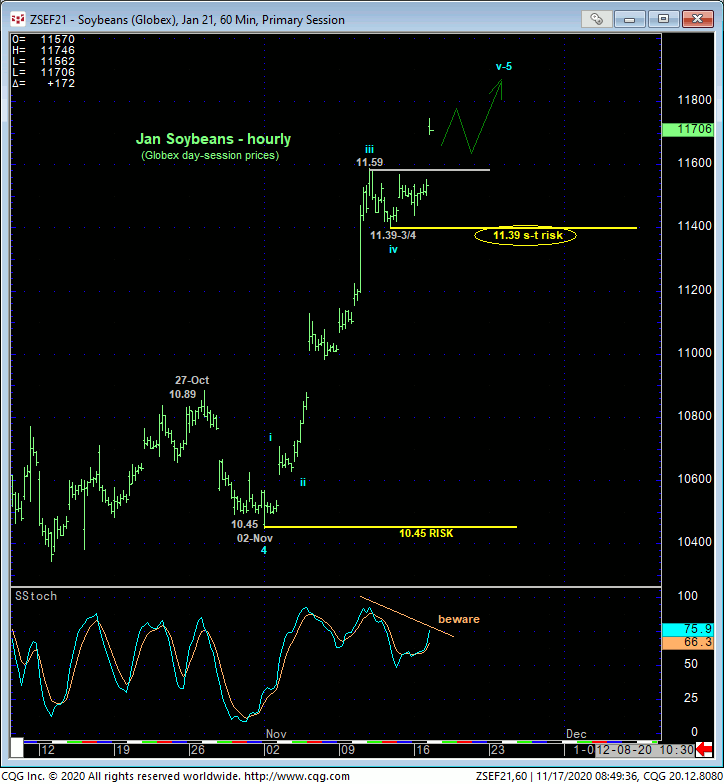
Only a glance is needed with the daily log scale chart below to see that the trend is up on all scales and should not surprise by its continuance of acceleration. 02-Nov’s 10.45 low remains intact as our key longer-term risk parameter this market is MINIMALLY required to fail below to, in fact, break this year’s major uptrend. A short-term momentum failure below the 11.39 smaller-degree corrective low discussed above would only allow us to conclude the end of the portion of the bull from 02-Nov’s 10.45 low, nothing more, nothing less. As is typically the case, technical and trading SCALE will be a crucial element to successfully and profitably navigate the inevitable peak and reversal of this major bull market. And currently, the market has defined these two levels 11.39 and 10.45- as those we believe will be the keys around which to gauge the bull’s resolve.
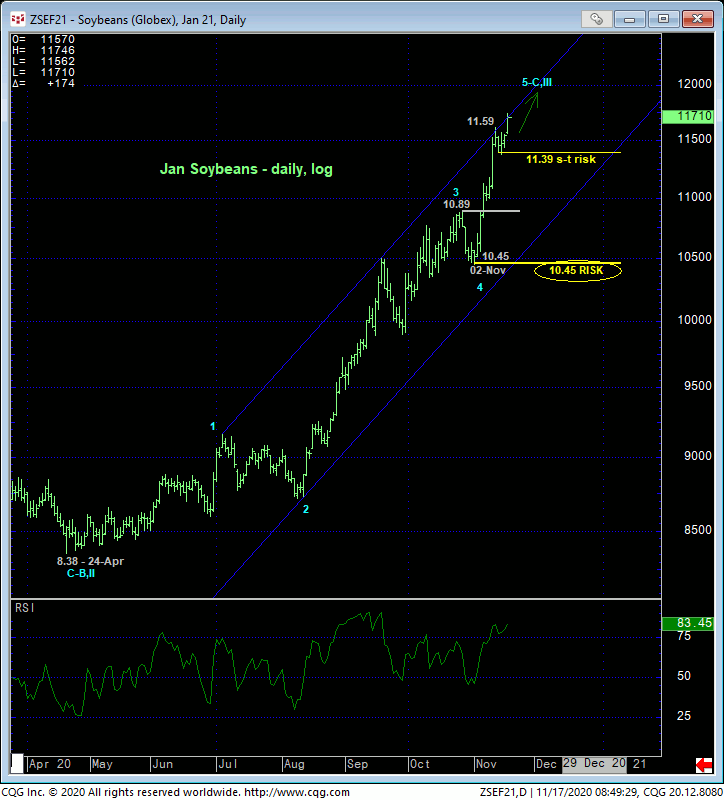
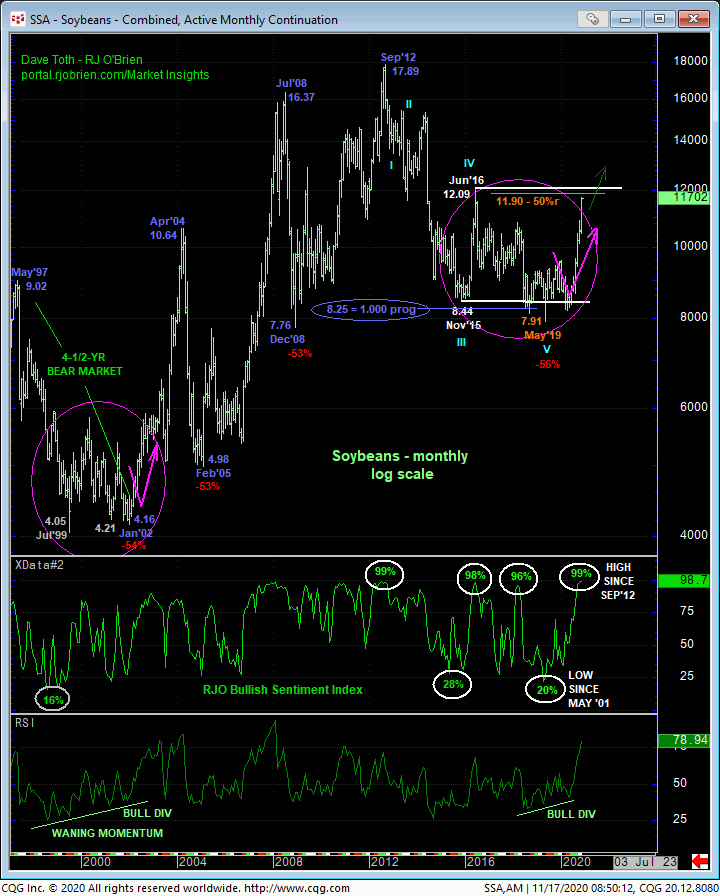
On an even broader scale, the major base/reversal from May’19’s 7.91 low is clearly the biggest since at least 2016’s bear market correction and cannot be overlooked as the same type of major reversal that followed the 5-year bear market from May’97’s 9.02 high to Jan’02’s 4.16 low shown in the monthly log chart below. Our multi-year major base/reversal count has been and remains predicated on the technical construct between Nov’15 and summer’19 that, in terms of momentum and sentiment, has been virtually identical to that from Jul’99 until early-2002. Now the challenge is in successfully navigating whatever amount of upside the bull has remaining.
The monthly chart shows the market’s encroachment on Jun’16’s 12.09 multi-year high and the (11.90) 50% retrace of the secular bear market from 17.89 to 7.91. While interesting, they’re of little help until and unless the market, quite simply, stems the clear and present and major uptrend. At this juncture, it’s all about MOMENTUM. And PROOF of weakness below recent corrective lows needed to even defer, let alone threaten the bull. Herein lies the importance of the risk parameters identified above. Until such weakness is shown, there’s no way to if this market will peak out around $12.00 or not until $17.00, r anywhere in between.
What’s also blatant in these long-term weekly and monthly charts are the frothy heights our market sentiment/contrary opinion indicators have reached. Such levels have warned of and accompanied major PEAK/reversal environments across all market sectors and we are sure that these indicators will play a pivotal role in a major top and reversal f the current soybean rally. Traders are reminded however that sentiment/contrary opinion is not an applicable technical tool in the absence of an accompanying confirmed bearish divergence in momentum. And as stated above, this, quite simply, requires proof of weakness below a prior corrective low. Concluding a top simply because of the frothy height of these sentiment indicators is the same as concluding the market’s “overbought” because the RSI is at 90%. Of course and as always, we’ve dispelled such foolishness as outside the bounds of technical discipline.
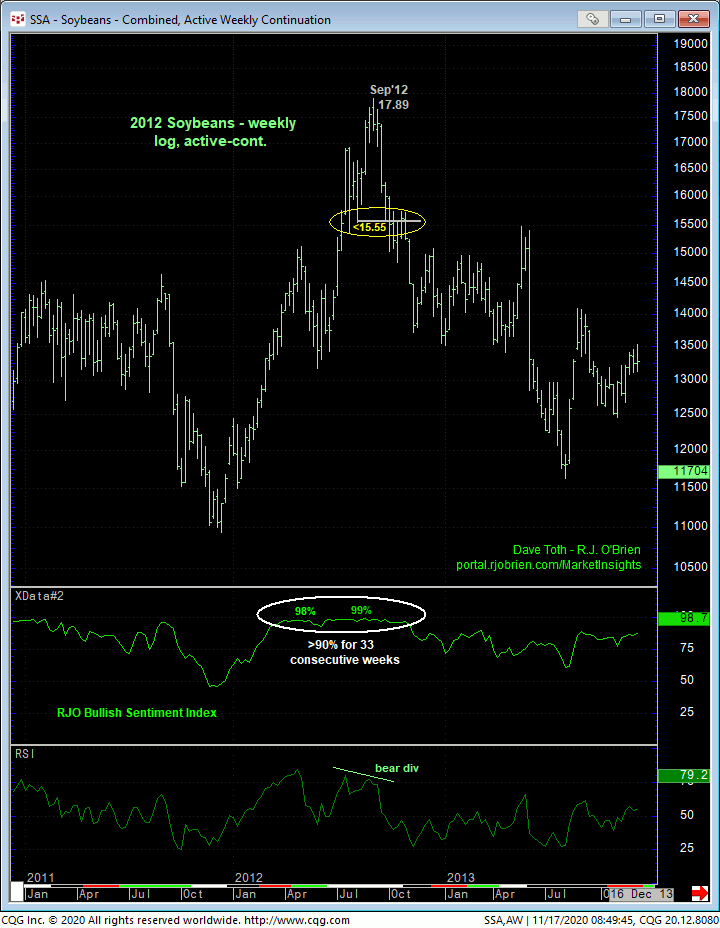
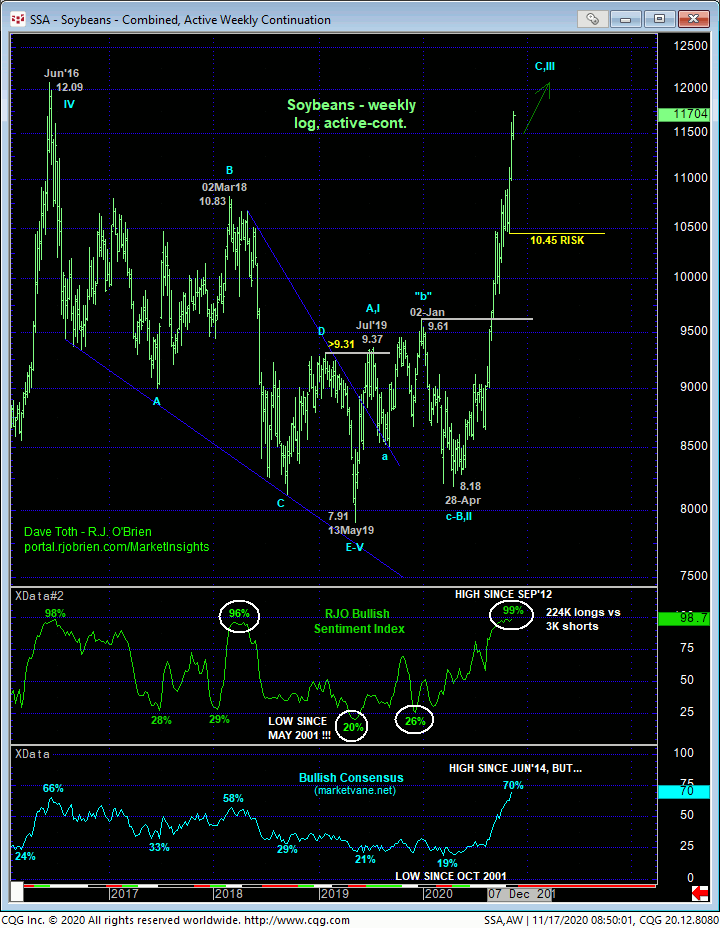
As the past 18-month rally is one of the greatest this market has seen since the infamous 2012 climax to the 10-yr secular bull from Jan’02’s 4.16 low, we thought it might be a good idea to revisit exactly how that major peak/reversal environment went down. First, in the weekly log chart above, we’d like to point out that our RJO Bullish Sentiment Index of the hot Managed Money positions reportable to the CFTC sustained levels above 90% for 33 consecutive weeks from the first week of Mar when the market was trading around 13.50 until the second week of Nov. During this time span, the major bull continued for roughly $4.00 and roughly five months. Might this be how much upside the current bull has? Of course, there’s no way to know. But until and unless the market confirms a bearish divergence in momentum of a scale sufficient to threaten the major bull, there is no objective reason to underestimate the bull’s upside potential.
The weekly chart above shows the market finally confirming a bearish divergence in momentum with 02-Oct’s larger-degree momentum failure below 08-Aug’s 15.55 corrective low. COMBINED with historically frothy sentiment, the market confirmed a peak/reversal threat that could be major in scope. And indeed, it was.
On an admittedly smaller scale shown in the daily chart of the Nov’12 contract below, it took 17-Sep’s break below 12-Sep’s 16.93 initial counter-trend low to confirm a bearish divergence in momentum that we admitted in 17Sep12’s Technical Blog was one of a smaller scale and insufficient to concluder a major peak. But with market sentiment as bullishly-skewed as it was, such a more protracted peak/reversal environment could be at hand. The other shoe dropped on 02-Oct with the bearish divergence in weekly momentum.
The key takeaways from this 2012-revisit are:
- MOMENTUM is key, with failures below corrective lows needed to even defer, let alone threaten the bull to the point of non-bullish action
- historically frothy sentiment/contrary opinion is of no matter until and unless the market confirms a momentum divergence below a prior corrective low
- the market’s remaining upside potential is indeterminable; it could peak out tomorrow or be extraordinary.
These issues considered, a full and aggressive bullish policy and exposure remain advised with a failure below 11.39 required for shorter-term traders to move to the sidelines and for longer-term players to pare exposure to more conservative levels and acknowledge the exchange of whipsaw risk (above whatever high is left in the wake of a sub-11.39 failure) for deeper nominal risk (below 10.45) on a portion of their position. In lieu of weakness below at least 11.39, further and possibly accelerated gains remain expected.
