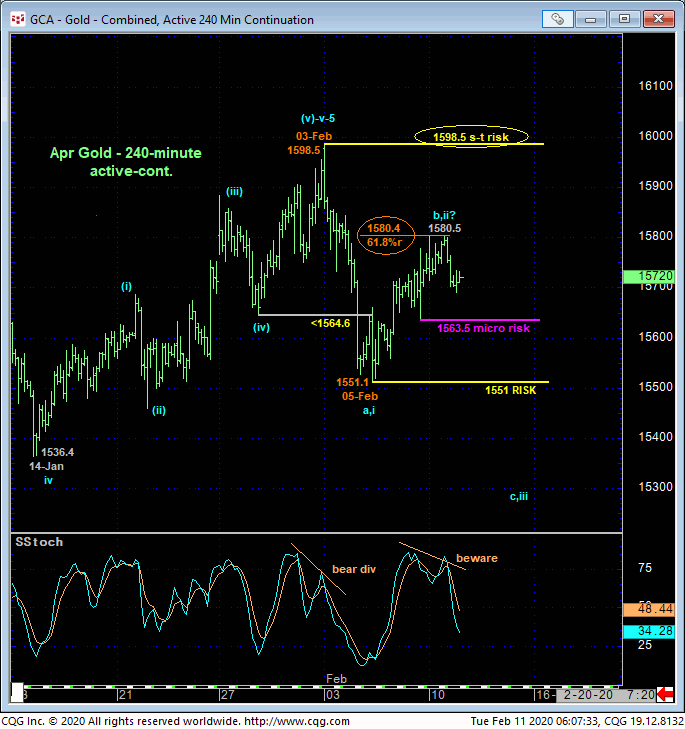
We introduced a peak/reversal threat in 04-Feb’s Technical Blog following that day’s bearish divergence in admittedly short-term momentum that identified 03-Feb’s 1598.5 high as one of developing importance and, for the moment, our short-term risk parameter from which non-bullish decisions like long-covers and cautious bearish punts can be objectively based and managed. Since then, the 240-min chart below shows that the market has retraced exactly 61.8% of last week’s initial 1598.5 – 1551.1 decline amidst waning upside momentum. If the market CONFIRMS this bearish divergence in very short-term momentum below Fri’s 1563.5 minor corrective low and micro risk parameter, then we’d have to conclude that the market was taking the next step in a broader peak/reversal process.
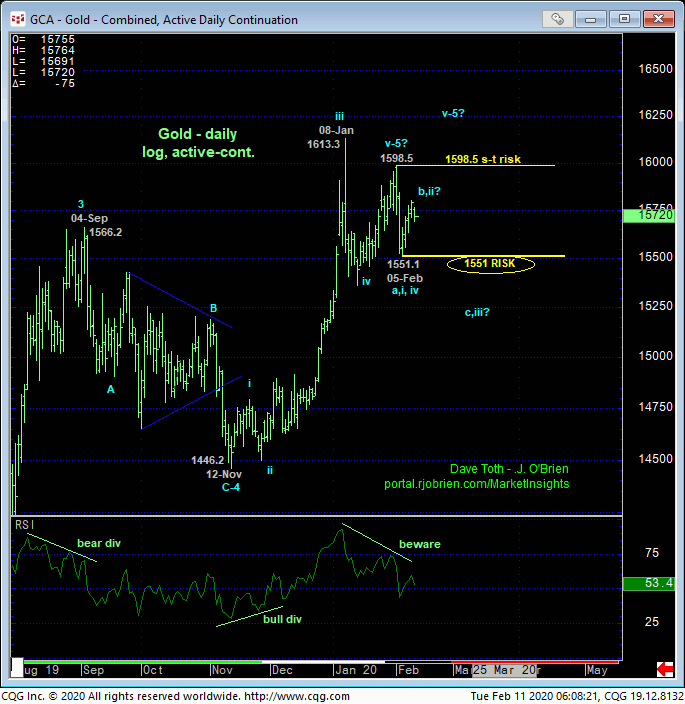
Against this developing backdrop and threat to the broader bull, we’re trailing our long-term bull risk parameter to last week’s 1551.1 low, the break below which would confirm that low as an initial counter-trend low and also confirm a bearish divergence in DAILY momentum that would, in fact, break the uptrend from at least 12Nov19’s 1446 low.


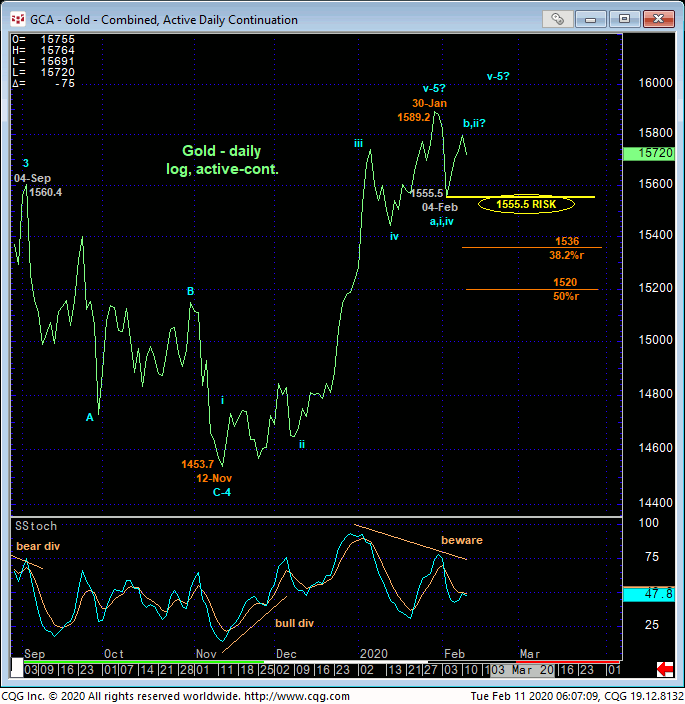
The daily log chart above shows the nicely developing POTENTIAL for a bearish divergence in momentum. This indicator will be considered CONFIRMED to the point of larger-degree non-bullish action on a break below 05-Feb’s 1551.1 initial counter-trend low that would, in fact, expose the new long-term trend as down. Contributing to this peak/reversal threat is a textbook 5-wave Elliott sequence from 12Nov19’s 1453.7 low to 30-Jan’s 1589.2 high on a daily close-only basis below. A close below 04-Feb’s 1555.5 low close and/or an intra-day break below 1551.1 will confirm the momentum divergence needed for even long-term players to move to a neutral-to-bearish policy.

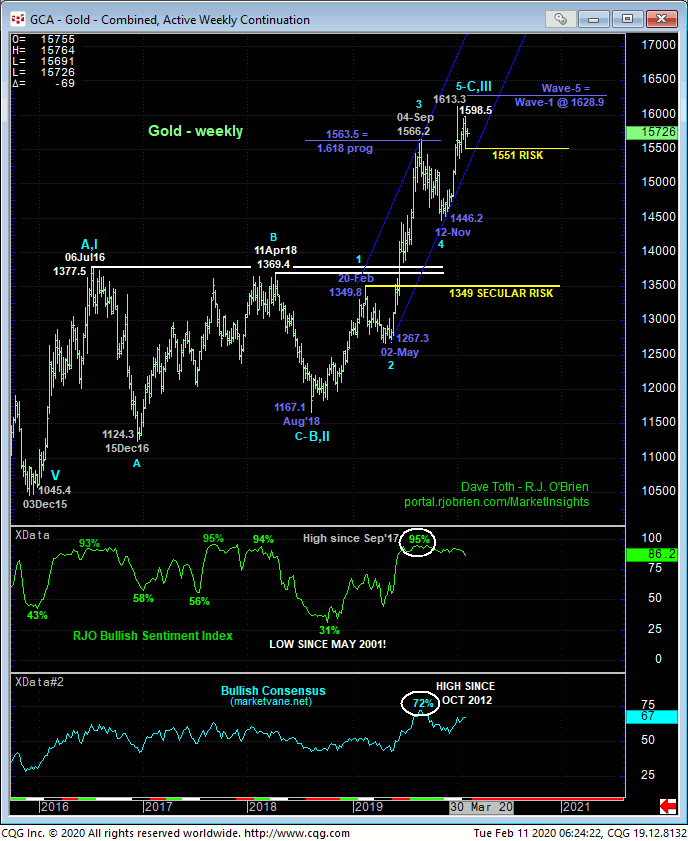
Lastly, from an even broader perspective, the weekly chart below shows historically frothy sentiment levels typical of such major peak/reversal environments as well as the prospect that the huge rally from Aug’18’s 1167.1 low is a complete 5-wave Elliott sequence as labeled. Now we’re not going to conclude the major reversal of a 17-month, $430 rally on a relatively short-term momentum failure below 1551. But what we WILL conclude are specific risk parameters at 1598.5 and even 1580.5 from which a bearish policy could be objectively based and managed ahead of indeterminable weakness and vulnerability thereafter, including what could be a multi-month or multi-quarter correction or reversal to the 1450-to-1375-area.
These issues considered, a bullish policy remains advised for long-term players with a failure below 1551 required to threaten this call enough to warrant its immediate cover. A neutral-to-cautiously-bearish policy is advised for shorter-term traders with a recovery above 1598.5 required to negate this cal, warrant its cover and reinstate the secular bull. The market’s current position in the middle of this pivotal 1551 – 1598-range is a coin flip, with a relapse below 1563.5 tilting the directional scales lower and a recovery above 1580.5 tilting them higher. This is an interesting one that requires some patience within the 1598 – 1551-range. But the direction of the inevitable breakout from this range could see a protracted move in the direction of the breakout.


