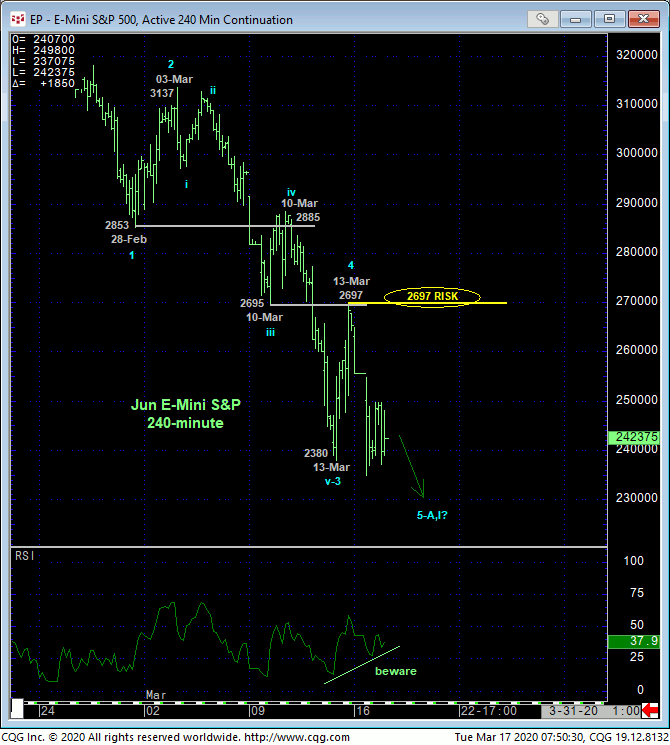
As we’ll discuss below, it’s going to remain questionable/debatable for quite a while whether the past month’s extraordinary meltdown is a 3- or 5-wave Elliott structure. What’s at stake is whether the market has completed a violent but quickie correction before the secular bull resumes in short order OR if this decline is just the start of a major, multi-quarter or even multi-year bear market akin to Oct’07 – Mar’08’s break that was only the INITIAL salvo in an eventual 58% bear. What we know for a fact is that by virtue of yesterday’s break below Fri’s 2380 low, the market has identified Fri’s 2697 high as the latest smaller-degree corrective high this market is now minimally required to recover above to confirm a bullish divergence in momentum needed to break the downtrend. Until and unless such 2697+ strength is shown, the trend remains down on all scales and should not surprise by its continuance. Per such, we’re defining 2697 as our new short-term risk parameter from which a bearish policy can be objectively rebased and managed.
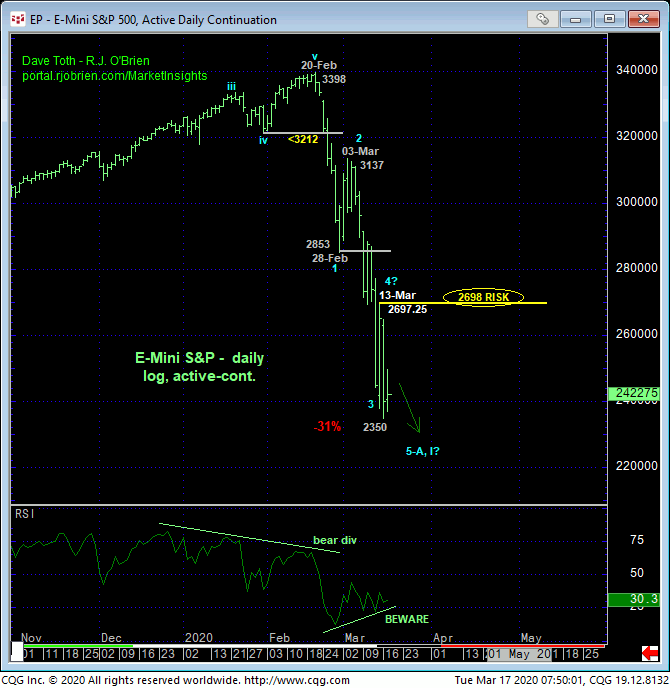
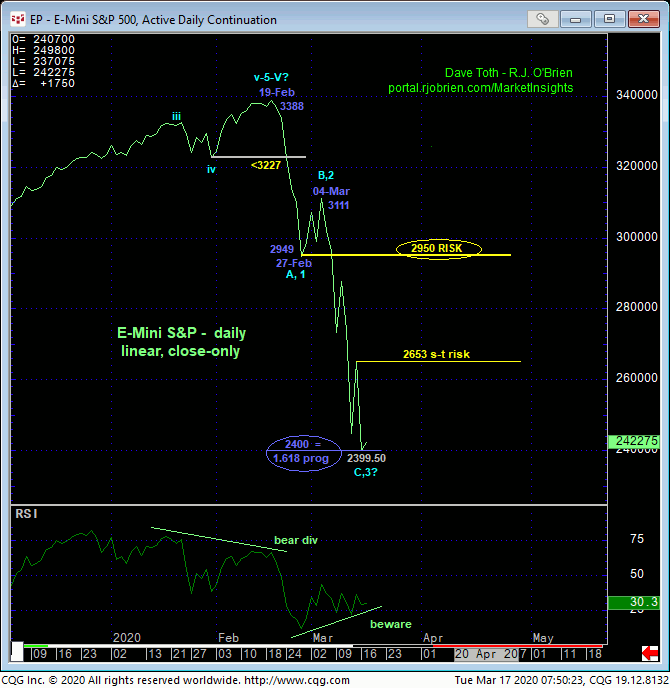
The 3-wave-vs-5-wave debate over the decline from mid-Feb’s high is clearer in the bar (above) and close-only (below) daily charts. But this debate is meaningless given the clear and present downtrend until and unless the market stems the slide with proof of strength above a prior corrective high like 2698 on an intra-day basis. On this daily basis however, these charts show the nicely developing POTENTIAL for a bullish divergence in momentum. A recovery above 2698 and/or a close above Fri’s 2653 corrective high close will CONFIRM the divergence to the point of non-bearish action like short-covers and cautious bullish punts. This said, it is important to understand that even a recovery above these Fri flexion points would still fall within the bounds of a mere (4th-Wave) correction given the magnitude of Mar’s portion of the break thus far.
For what it’s worth however (and it’s not worth spit unless the market closes above 2653), the decline from 04-Mar’s 3111 corrective high close is precisely 61.8% longer (i.e. 1.618 progression) of Feb’s preceding 3388 – 2949 decline on a linear close-only basis below. This Fibonacci fact could proof startling and contribute to a broader base/reversal count, but only after verification via a confirmed bullish divergence in momentum.
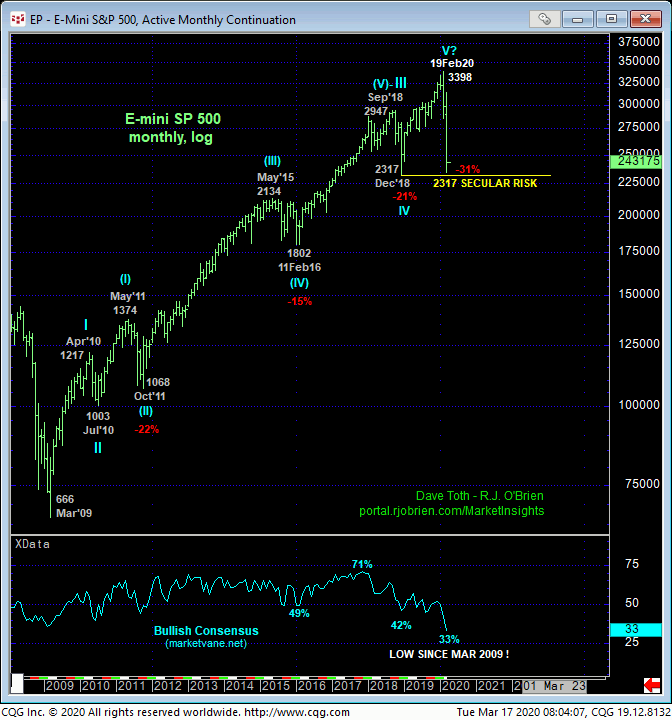
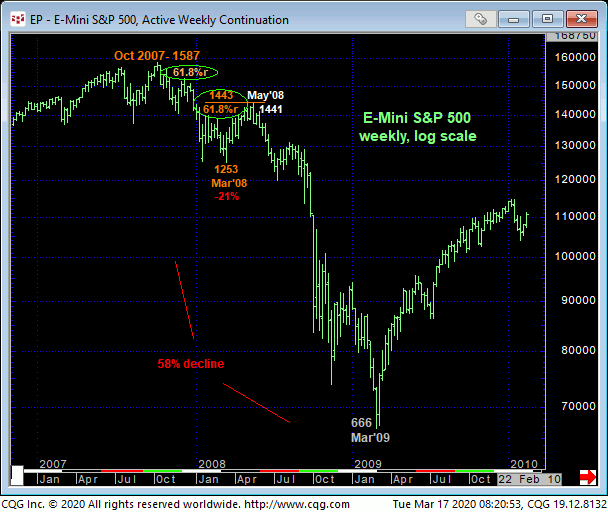
Finally, the magnitude of the past month’s 31% collapse (thus far) is put in perspective when compared against the backdrop of the secular bull trend sown in the monthly log chart above. The prospect that the entire 2009 – 2020 rally from 666 to 3398 is a complete 5-wave Elliott sequence is clear. if correct, this could easily mean a couple years’ of “correction” that would be major in scope that could rival the 2007-09 bear.
Thus far, the past month’s decline is by far the biggest since 2007 – 2009’s 58% bear market and major correction. It’s very much worth keeping in mind however that in that 2007-09 calamity, the market countered the sell-off with not one, but TWO 61.8% corrections before more protracted losses ensued. The first 3-week, 61.8% correction followed an initial 7-week decline from Oct-Nov decline. The second 61.8% retrace followed Oct’07 – Mar’08’s decline and spanned TWO FULL MONTHS. THEN the real, protracted, relentless bear market took hold, arguably EIGHT MONTHS after the top.
The point here is that the market never makes it easy on the huddled masses. There’s obviously been a ton of liquidation over the past few weeks. We believe its unlikely that the market will continue to reward this “getting out” with continued losses. Rather, we suspect that somewhere along the line AND AFTER A CONFIRMED BULLISH DIVERGENCE IN MOMENTUM NEEDED TO STEM THE SLIDE, this market will correct higher and potentially “extensively”, retracing 50% or 61.8% of the recent blood bath before we have some monumental decisions to make about the next couple years’ future.
In sum and for the time being, a bearish policy remains advised with an intra-day recovery above 2698 and/or a close above 2653 minimally required to confirm a bullish divergence in momentum needed to stem this clear and present downtrend and expose a corrective rebuttal that could be equally extensive. In lieu of such strength, further and perhaps steep losses should not surprise.
