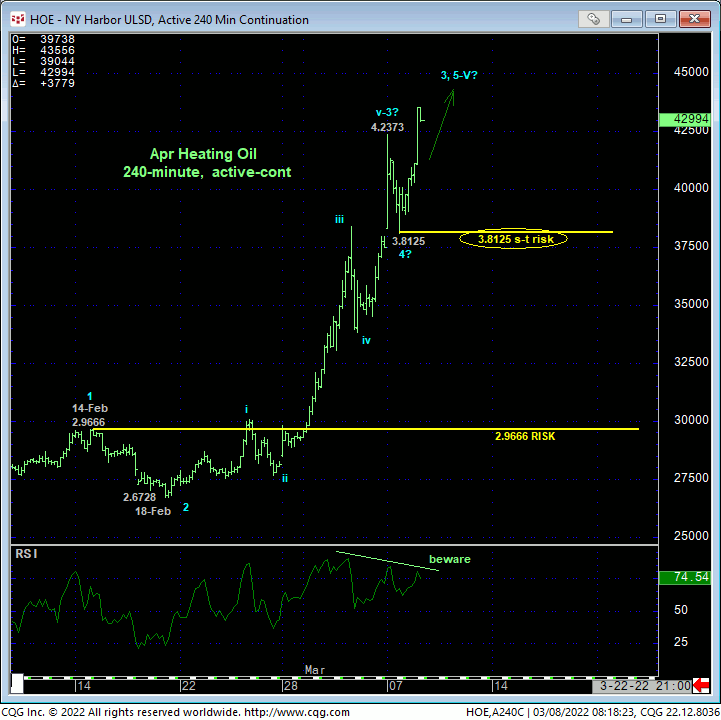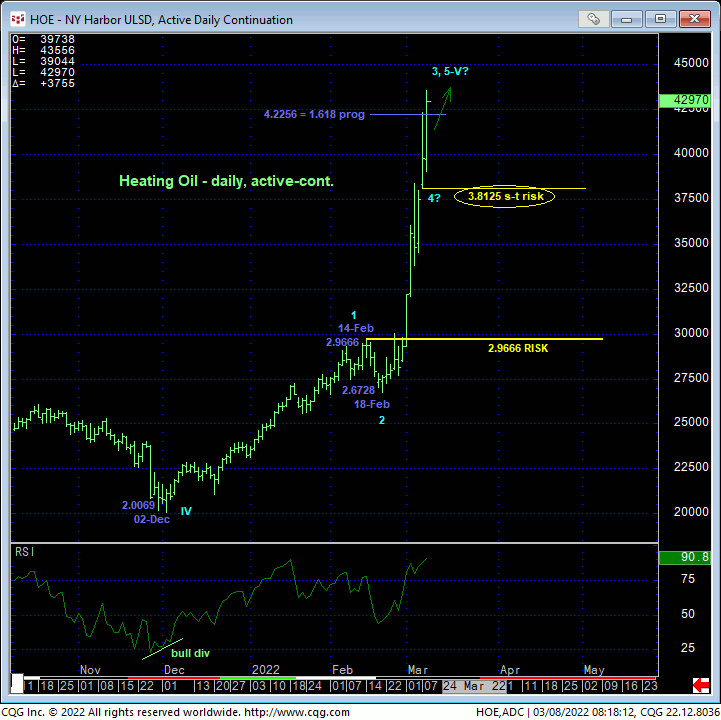

Today’s continuation of the secular bull trend, this time above yesterday’s 4.2373 high detailed in the 240-min chart above, identifies yesterday’s 3.8125 low as the latest smaller-degree corrective low this market is now minimally required to fail below to confirm a bearish divergence in short-term momentum and expose at least an interim correction lower that, given recent volatility and historically high nominal prices, could be relatively significant in scope. Per such, yesterday’s 3.8125 low is considered our new short-term risk parameter from which both short- and longer-term traders are advised to rebase and manage the risk of a still-advised bullish policy and exposure.
Again, given current extraordinary circumstances and the impracticality of any long-term risk parameters like 14-Feb’s 2.9666 1st-Wave high that would be pertinent to longer-term commercial players, we advise even longer-term players to acknowledge and accept whipsaw risk below an admittedly short-term risk parameter in exchange for much deeper nominal risk below 2.9666.


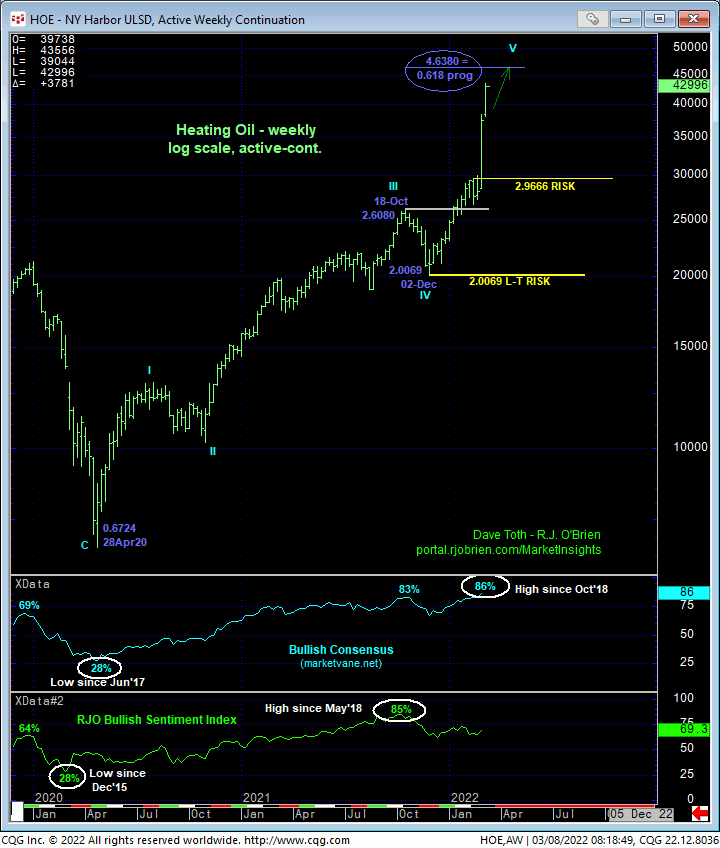
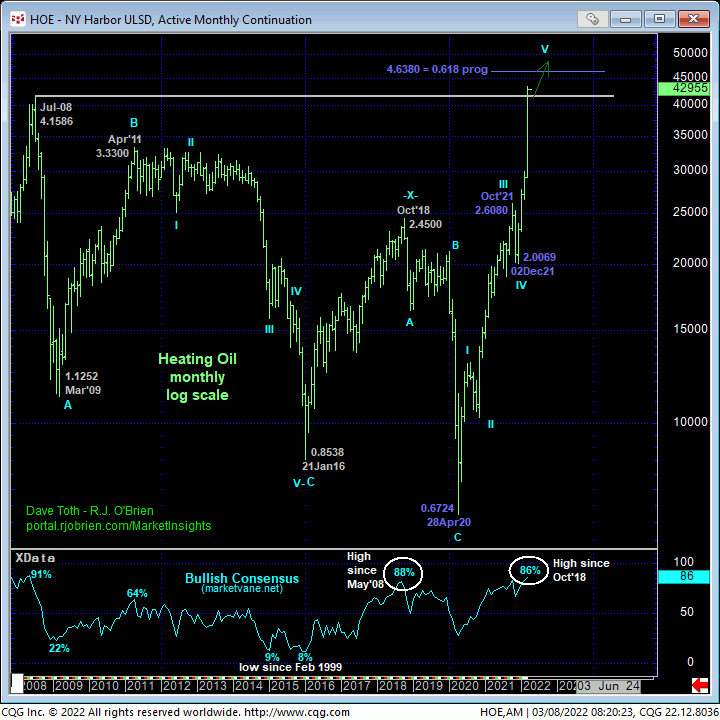
On a much broader scale, the dominance of the secular bull trend is clear in the weekly (above) and monthly (below) log scale active-continuation charts. Understandably historically frothy bullish sentiment WILL eventually come home to roost and contribute to a peak/reversal process that will be major in scope. But we would remind traders that sentiment/contrary opinion is not an applicable technical tool in the absence of an accompanying confirmed bearish divergence in momentum of a scale sufficient to threaten the major bull trend. And while a failure below yesterday’s smaller-degree corrective low and short-term but key risk parameter is NOT of such a sufficient scale, the extent of the market’s downside vulnerability below such a level is just to indeterminable and potentially steep to ignore.
It’s also notable in both these long-term perspectives that the rally from 02-Dec’s 2.0069 low is arguably the completing 5th-Wave of a massive Elliott sequence that dates from Apr’20’s 0.6724 low. And interestingly, the market is now within spittin’ distance of the (4.6380) 0.618 progression of the net distance of Waves-I-thru-III (0.6724 – 2.6080). But to render this merely derived Fibonacci relationship relevant, the market MUST first arrest the clear and present and major uptrend with a confirmed bearish divergence in momentum. Herein lies the importance of even admittedly smaller-degree corrective lows and risk parameters like 3.8125. Until and unless such weakness is shown, the trend remains up on all scales and should not surprise by its continuance or acceleration.
In sum, a bullish policy and exposure remain advised with a failure below 3.8125 required to defer or threaten this call enough to warrant moving immediately to the sidelines. In lieu of such weakness, further and possibly accelerated gains remain expected.


