FEB CRUDE OIL
Fri’s slip below a very minor initial counter-trend low of 61.09 from Mon confirms a bearish divergence in very, very short-term momentum as shown in the 240-min chart below. This minor mo failure defines Mon’s 62.34 high as one of developing importance and POSSIBLY the end of a 5-wave Elliott sequence dating from 20-Nov’s 54.85 low as labeled below. Adhering to technical discipline however, commensurately larger-degree weakness below 20-Dec’s 60.02 corrective low remains required to confirm a bearish divergence in momentum of a SUFFICIENT SCALE to conclude the end of Dec’s broader uptrend. Per such, these two levels- 62.34 and 60.02- define specific micro- and short-term risk parameters around which directional biases and exposure can be objectively based and managed.
Scalpers are OK to neutralize bullish exposure and even take a punt from the bear side with a recovery above 62.34 negating this call, warranting its cover and resurrecting the broader bull trend. Short-term traders are advised to pare bullish exposure to more conservative levels and jettison the position altogether on a failure below 60.02.
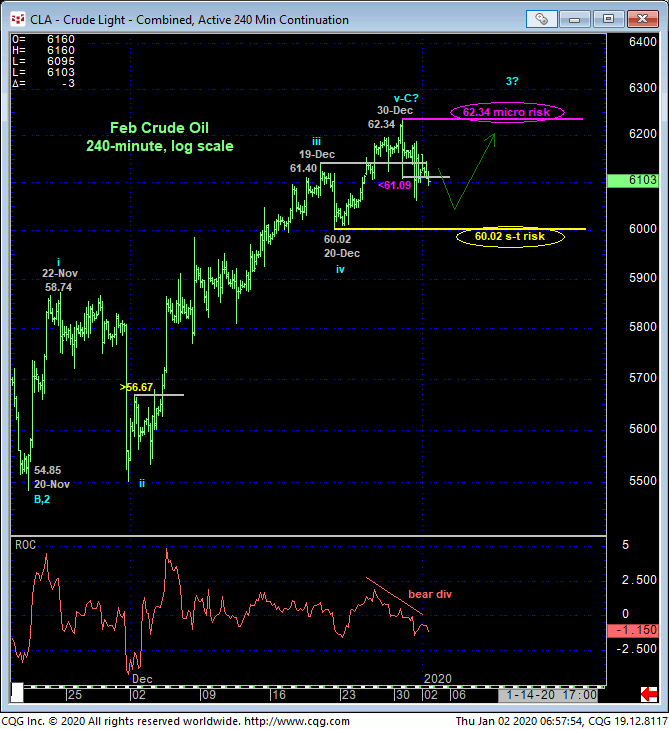
These admittedly tight risk parameters may come in very handy given:
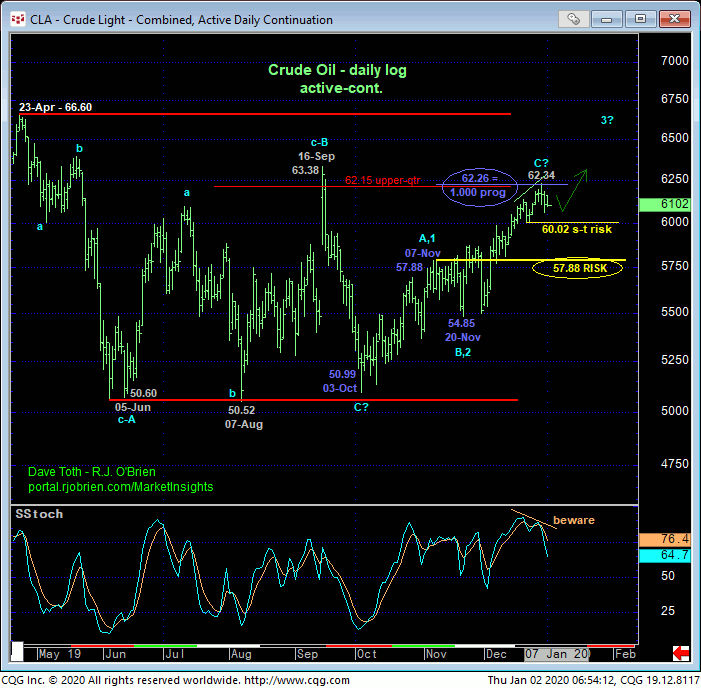
- the nicely developing potential for a bearish divergence in momentum on a daily log scale basis below
- the market’s nibble once again at the upper-quarter of 2019’s 50-to-66-range
- the prospect that the nearly-four-month rally from 03-Oct’s 50.99 low is a complete 3-wave Elliott sequence as labeled in the daily chart below and
- the Fibonacci fact that the (prospective C-Wave) rally from 20-Nov’s 54.85 low is virtually identical in length (i.e. 1.000 progression) to Oct-Nov’s 50.99 – 57.88 (prospective A-Wave) rally.
Against the backdrop of a merely lateral range that has dominated price action the past year, we believe erring on the side of a more conservative approach to risk assumption “up here” is preferred. Sure, “theoretically”, commensurately larger-degree weakness below 07-Nov’s 57.88 prospective A-Wave high is required to negate an alternate bullish count that would contend the rally from 20-Nov’s 54.85 low is the dramatic 3rd-Wave of an eventual and major 5-wave rally from the Oct low. But making non-bullish decisions like long-covers that far back into the middle-half bowels of the past year’s range doesn’t seem to make that much sense to us, even for longer-term players.
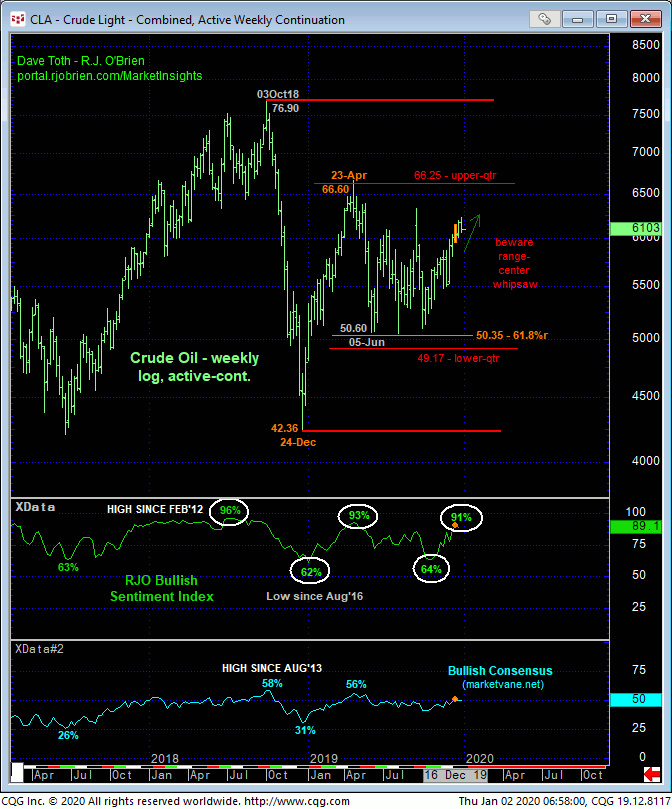
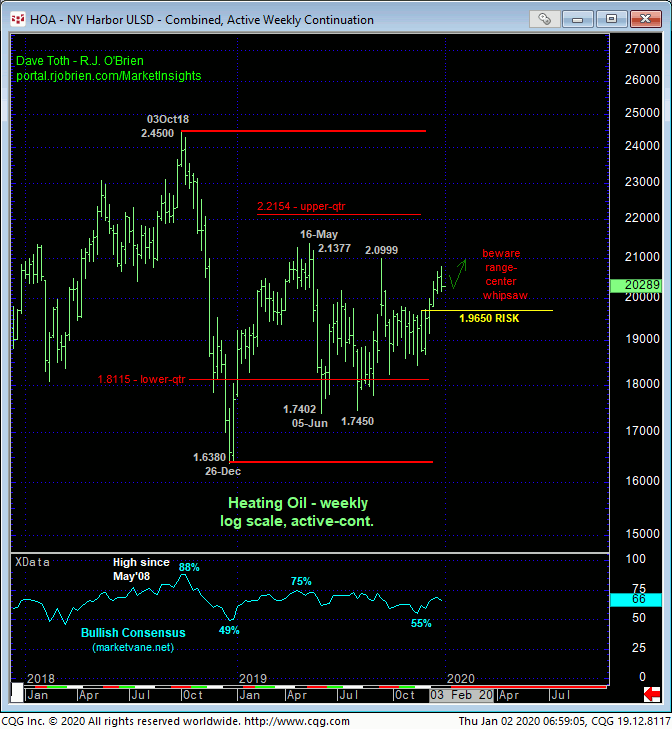
Finally, on an even broader scale, the weekly log chart below shows the market’s position still within the middle-half of a range that arguably dates back over two years and where we’re tasked with identifying odds of either a sharp, major continuation of the past quarter’s uptrend to levels above 23Apr19’s 66.60 high OR another relapse into the bowels of the range. An admittedly short-term mo failure below 60.02 would be of an insufficient scale to negate the broader bullish count and confirm another intra-range relapse. But what a sub-60.02 failure WOULD DO is reinforce Mon’s 62.34 high as one of developing importance and confirm it as our new short-term risk parameter from which non-bullish decisions like long-covers and cautious bearish punts can be objectively based and managed.
These issues considered, traders are advised to toggle directional biases and exposure around this admittedly tight but we think acute and pertinent range of 62.34-to-60.02 commensurate with one’s personal risk profile. A cautious bearish policy is OK for scalpers with a recovery above 62.34 negating this call and warranting its cover. A cautious bullish policy remains OK for all other traders, with a failure below 60.02 sufficient to threaten this cal enough to warrant moving to a neutral-to-cautiously-bearish stance below 60.02.
FEB HEATING OIL
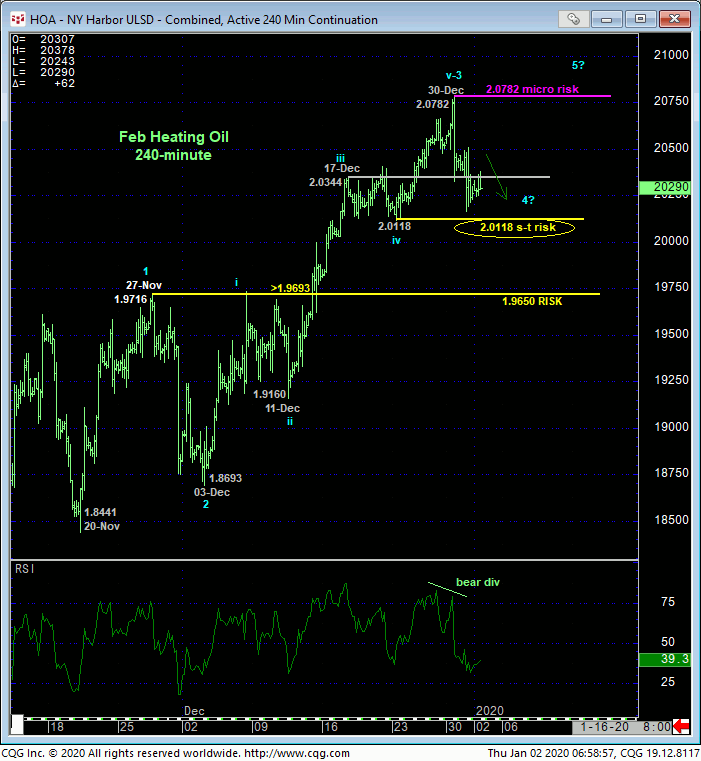
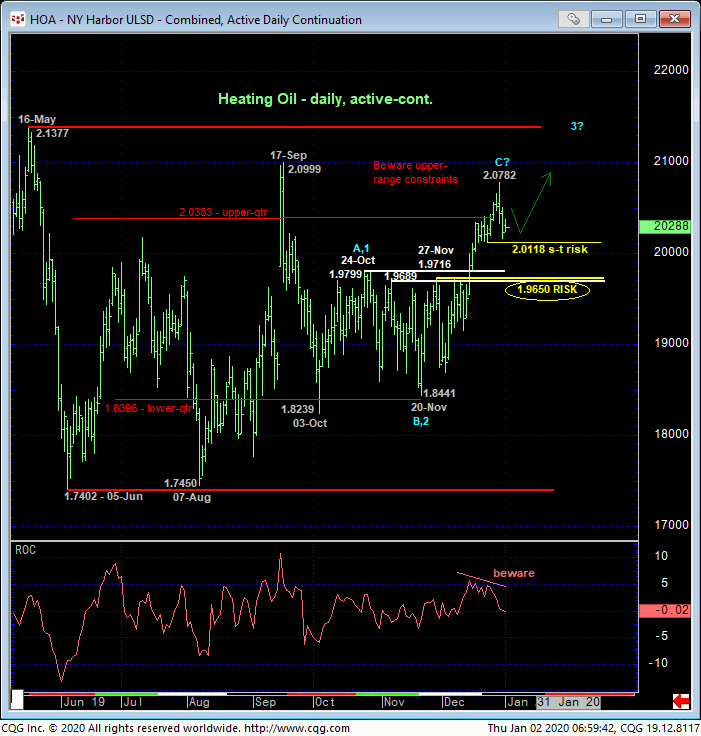
The technical construct and expectations for the heating oil market are identical to those detailed above for crude with the 2.0782 and 2.0118 levels now serving as our new micro and short-term risk parameters around which directional biases and exposure can be objectively toggled. Key former 1.9680-to-1.9800-area resistance serves as a significant new support candidate heading forward. For long-term players, a break below 1.9650 is required to truly break Nov-Dec’s not-unimpressive uptrend and confirm a reversion to the middle-half bowels of this year’s incessant lateral range.
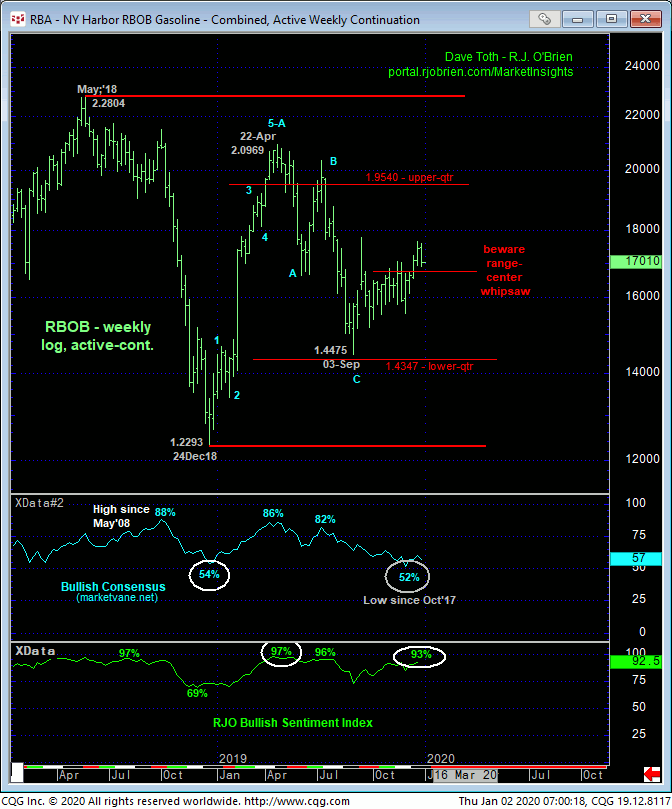
FEB RBOB
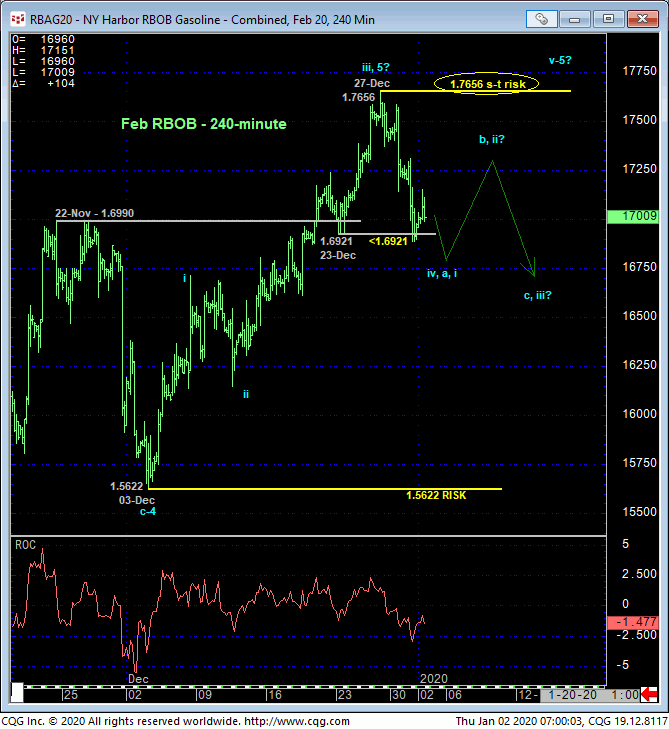
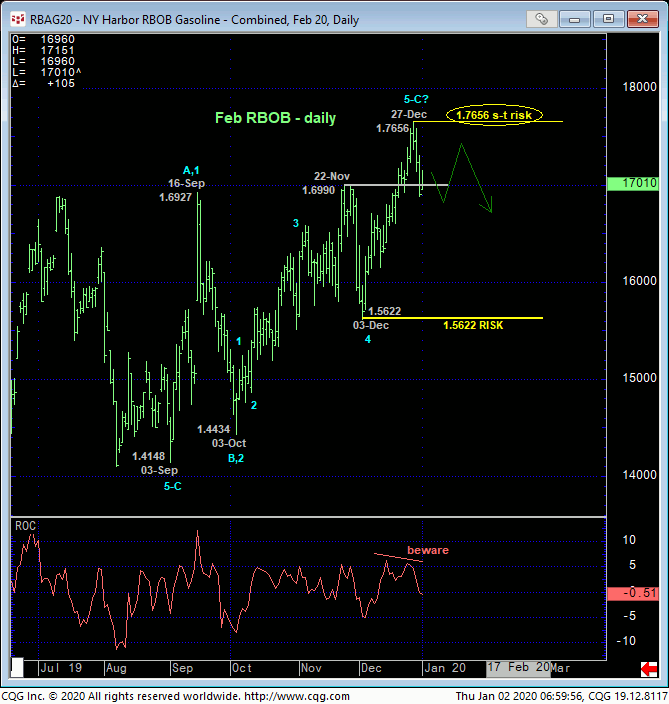
Given what we believe is a tenuous nature of the past few months’ rallies in crude and heating oil above, it’s not surprising to see a confirmed bearish divergence in short-term mo in RBOB on Tues below 23-Dec’s 1.6921 corrective low that, in fact, breaks at least Dec’s portion of the bull from 1.5622 to 27-Dec’s 1.7656 high. As a result of this mo failure, the market has identified that 1.7656 high as THE level it needs to recoup to mitigate any peak/reversal count and reinstate the bull. Per such, this 1.7656 level becomes our new short-term risk parameter from which non-bullish decisions like long-covers and cautious bearish punts can be objectively based and managed.
From a longer-term perspective, commensurately larger-degree weakness below 03-Dec’s 1.5622 next larger-degree corrective low and key risk parameter remains required to, in fact, break 4Q19’s broader uptrend. Under this year’s broader, lateral, rangey circumstances, that 1.5622 low and risk parameter is not very practical at all, so traders are advised to err on the side of a more conservative approach to risk assumption and exchange whipsaw risk for greater nominal risk and move to a neutral-to-cautiously-bearish stance “up here” until negated by a whipsaw above 1.7656.
The sentiment/contrary opinion fact that our RJO Bullish Sentiment Index is at a historical extremity of 93% would seem to reinforce the slippery slope for bulls “up here”.
These issues considered, traders have been advised to move to a neutral/sideline policy as a result of Tue’s admittedly short-term mo failure below 1.6921, with a recovery above 1.7656 required to negate this call and reinstate the bull. We will be watchful for proof of 3-wave, labored, corrective behavior on a retest attempt of that 1.7656 high in the days/week ahead for a preferred risk/reward selling opportunity.
