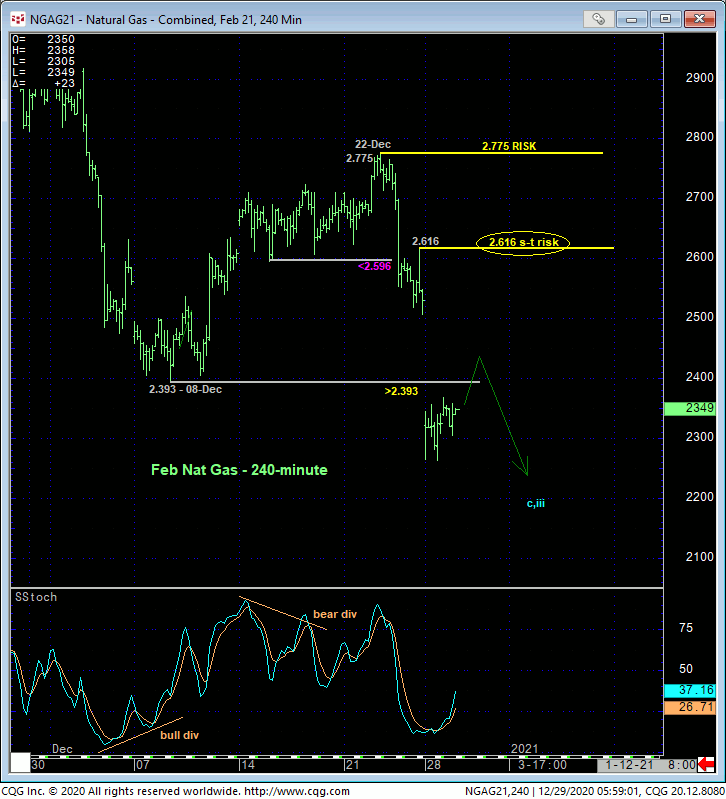
Since 03-Nov’s bearish divergence in momentum threatened Jun-Oct’s impressive reversal that we believe is just the (A- or 1st-Wave) start to a major multi-quarter base/reversal process, we’ve discussed the prospect for a very treacherous, volatile (B- or 2nd-Wave) corrective relapse that could be extensive in terms of both price and time and perhaps expose a run at the 2.50-to-2.00-area where a preferred risk/reward buying opportunity might present itself. Only a glance at the 240-min chart below is needed to see further proof of this aimless, volatile price action with yesterday’s resumed plunge to a new lows below 08-Dec’s 2.393 low in the now-prompt Feb contract. This resumed decline followed 10-Dec’s bullish divergence in short-term momentum that arrested a 6-week collapse and 23-Dec’s recovery-stemming bearish divergence in mo that re-exposed it.
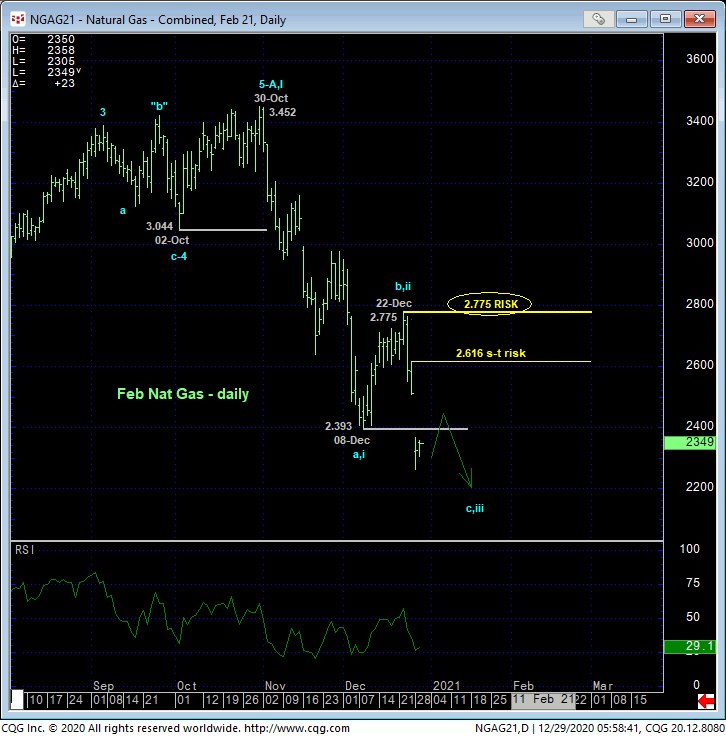
The important takeaway from the past few days’ resumed decline is the market’s definition of smaller- and larger-degree corrective highs at 2.616 and 2.775, respectively. These levels not only serve as our new short- and long-term risk parameters from which an increasingly cautious bearish policy and exposure can be objectively rebased and managed, but also the thresholds from which the bear’s (B- or 2nd-Wave corrective) resolve can be gauged within the long-term BASE/reversal count ahead of an eventual reversal higher.


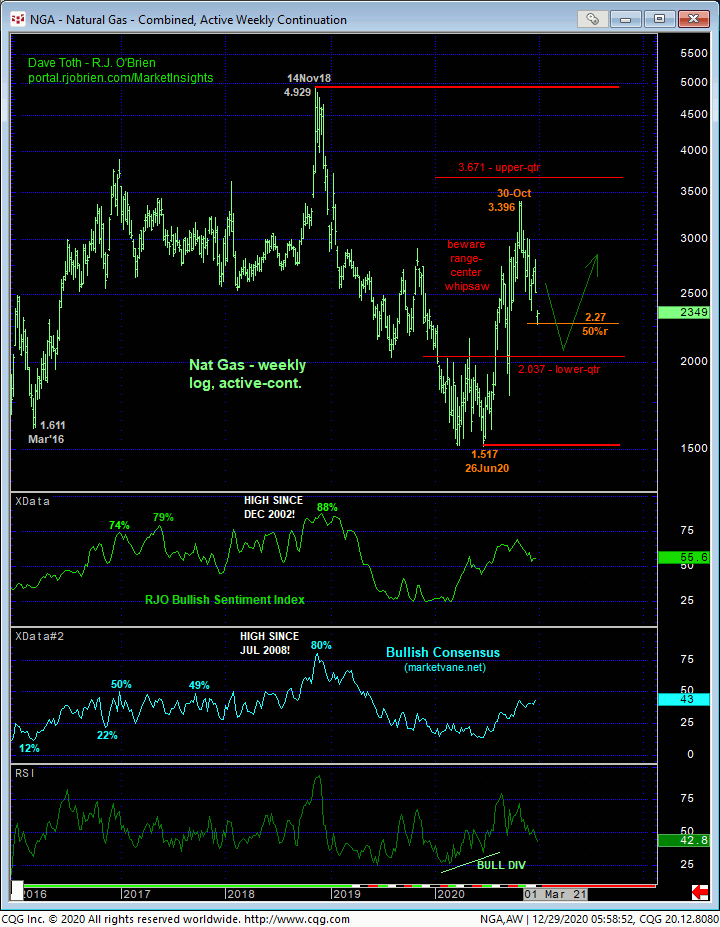
The daily chart above clearly shows the resumed downtrend and 22-Dec’s 2.775 corrective high the market is now required to recoup to confirm a bullish divergence in momentum on a scale sufficient to break Oct-Dec’s downtrend. The weekly log active-continuation chart below shows the market’s encroachment on the 2.50-to-2.00-range we’ve targeted as an “area of interest” around which to be on the watch for a relapse-countering bullish divergence in momentum that could present a favorable and long-term risk/reward buying opportunity for two reasons:
- it’s the lower-quarter of the range that has encapsulated this market for the past FIVE YEARS and
- it’s the approximate 50% retrace (around 2.27) of Jun-Oct’s 1.517 – 3.396 rally on a log scale basis.
TO BE SURE, these facts alone are NO reason to start dusting off the left side of your trade ticket. But they identify a suspicious area and condition around which to be watchful for the requisite bullish divergence in momentum that, if confirmed, would tip the longer-term directional scales back to the bull side just like 03-Nov’s bearish divergence in mo tipped it to the bear side.

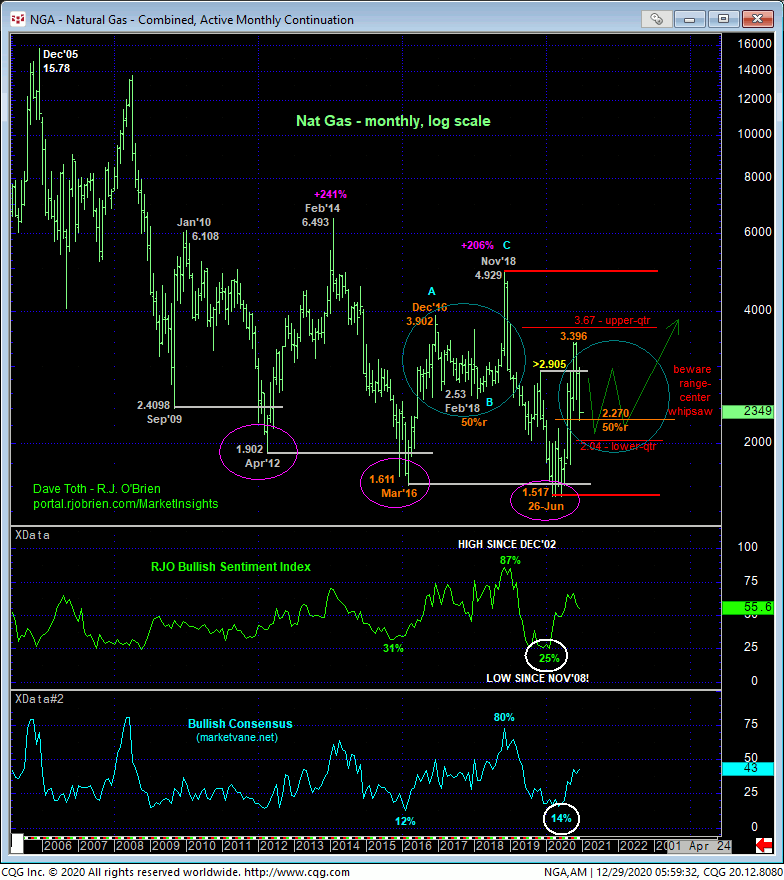
The importance of these factors becomes clearer when we take a long-term monthly view into consideration where, in 03-Aug’s Technical Blog, we introduced a base/reversal count expected to be as major as the 200+%, 2-1/2-year reversal from Mar’16’s 1.611 low. In terms of momentum and contrary opinion, the technical construct of Mar-Aug’s price action was virtually identical to that of 2016’s major bottom and reversal.
WITHIN that 2-1/2-year, 200+% reversal however was an extensive 14-month, 50% retracement of Mar-Dec’16’s initial (A-Wave) rally from 1.611 to 3.902. The 2.53-to-4.929 (C-Wave) resumption of the reversal was a golden risk/reward opportunity. If such a resumed, C-Wave rally lies ahead to reaffirm our major, multi-quarter base/reversal count, we believe/suspect the lower-2.00-handle-area will arrest the clear and present (B-Wave) decline. And we will gauge this prospect precisely around recent corrective highs and bear risk parameters like 2.775 and even 2.616. Further lateral-to-lower price action may produce even tighter such bear risk levels in the weeks or months ahead. Until the market CONFIRMS a bullish divergence in momentum however, further lateral-to-lower prices should not surprise. The deeper into the 2.00-handle the market erodes however, the keener the watch should be for waning downside momentum, the developing potential for a bullish divergence in momentum and the specific short- and longer-term risk parameters around which to conclude the divergence and shift to a bullish policy.
These issues considered, a neutral-to-cautiously-bearish policy and exposure remain advised with a minimum recovery above 2.616 required to change this narrative. In lieu of such 2.616+ strength, further lateral-to-lower prices towards the 2.20-to-2.00-range should not surprise.


