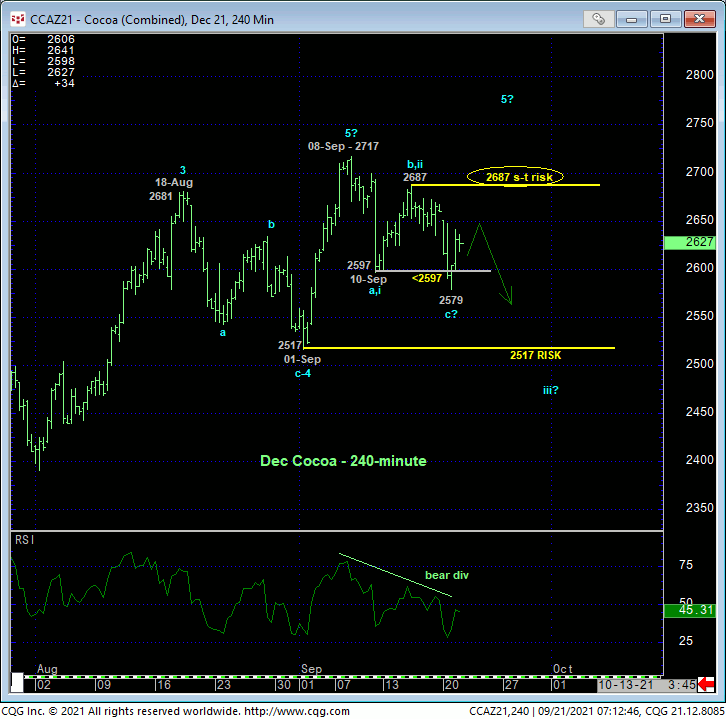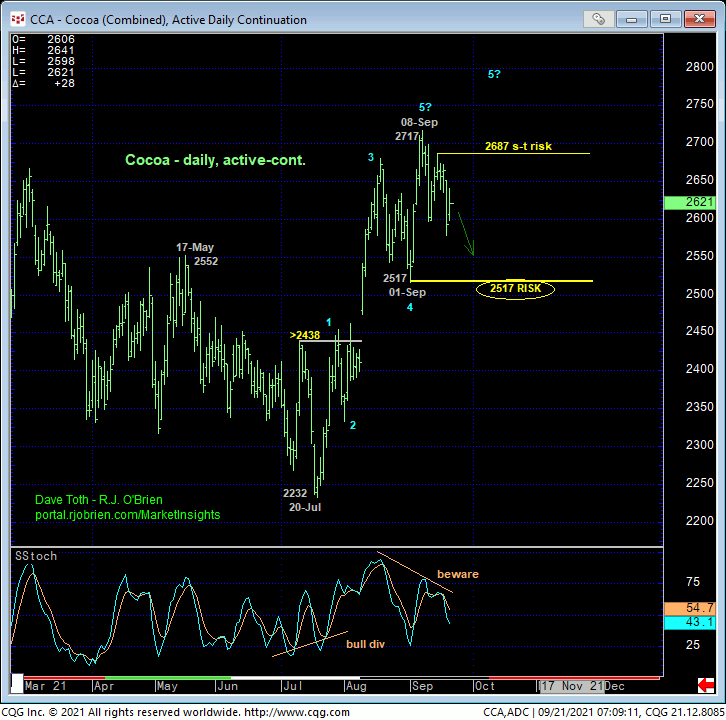

The 240-min chart above shows the market’s failure yesterday below 10-Sep’s 2597 initial counter-trend low and our short-term risk parameter discussed in Thur’s Technical Webcast that confirms a bearish divergence in short-term momentum. This admittedly short-term mo failure is not enough to break the broader uptrend from 20-Jul’s 2232 low, but it is more than sufficient to define 15-Sep’s 2687 high as the latest smaller-degree corrective high that this market is now required to recover above to render the sell-off attempt from 08-Sep’s 2717 high a 3-wave and thus corrective affair that would then re-expose the two-month rally. In this regard, this 2687 high serves as our new short-term risk parameter from which traders can objectively base non-bullish decisions like long-covers and cautious bearish punts.
To break the broader recovery from 20-Jul’s 2232 low. commensurately larger-degree weakness below 01-Sep’s 2517 larger-degree corrective low and key risk parameter remains required to confirm a bearish divergence in DAILY momentum below. In effect, we believe this market has defined 2517 and 2687 as the key directional triggers heading forward. But before moving out to some key long-term elements below, we’d also like to point out the prospect that 08-Sep’s 2717 might have completed a textbook 5-wave Elliott sequence up from 20-Jul’s 2232 low. This count will be considered confirmed on a failure below 2517.


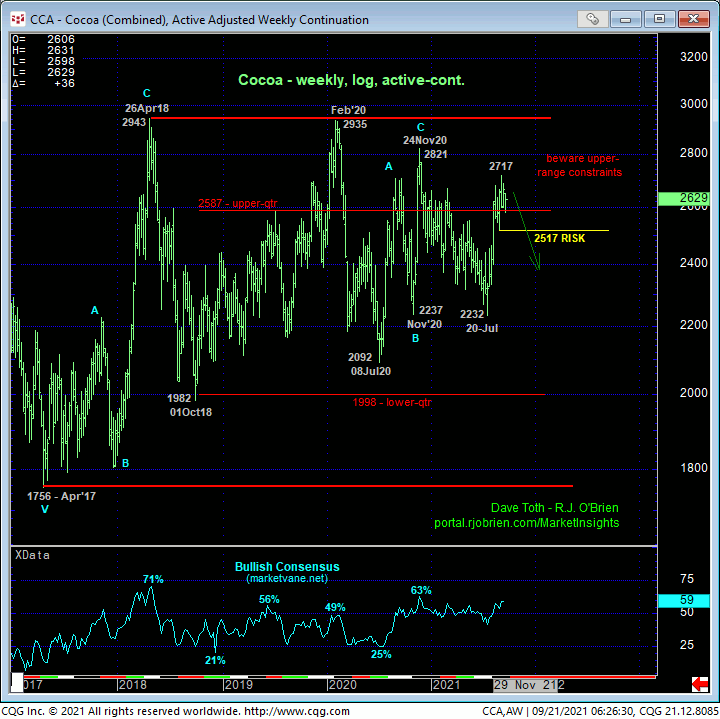
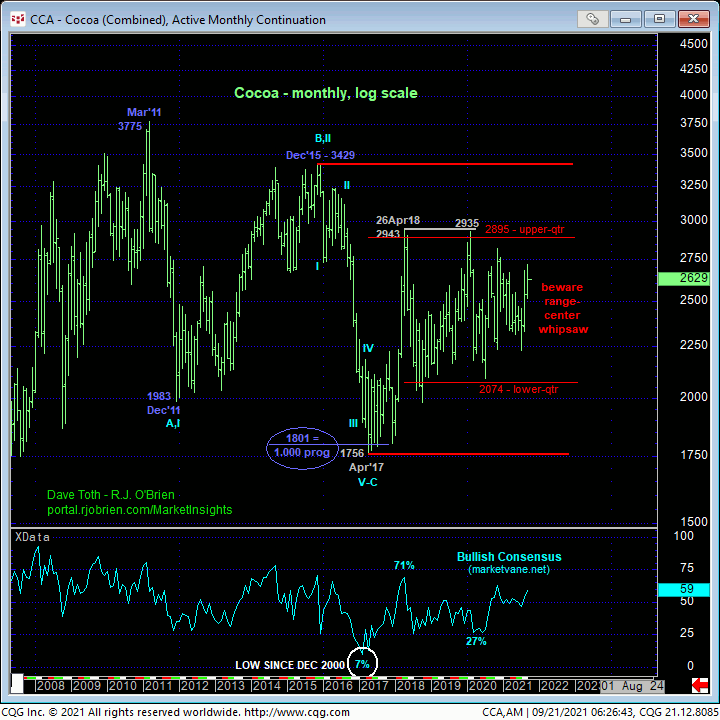
On a much longer-term scale, the weekly log chart above shows the market’s recent foray into the upper-quarter of the past FOUR YEARS’ incessant lateral range that has repelled every rally attempt over that span. Moreover, this four year range is a middle-half subset of this market’s historically massive lateral range that has imprisoned it for the past 13 YEARS where the odds of aimless lateral chop and whipsaw risk remain high. This market hasn’t sustained any sort of trend for at least the past four years. Against this backdrop, we believe the odds of this market sustaining it’s poke into the upper-quarter of this range are poor, requiring only a bearish divergence in momentum to arrest this poke and expose another intra-range relapse.
Is yesterday’s momentum failure enough to conclude another relapse to the 2200-to-2400-area middle-half bowels of the 4-year range? No. As stated above, a failure below 2517 remains required for such a conclusion. But yesterday’s short-term failure IS enough to define last week’s 2687 high as an objective risk parameter for such a bearish punt. And with the 59% Bullish Consensus flirting with multi-year highs that have warned of and accompanied prior intra-range relapses, a cautious bearish policy is advised from current 2625-area prices with a recovery above 2687 required to negate this specific call and warrant its cover. Commensurately larger-degree weakness below 2517 will reinforce this count and prospect for another intra-range relapse to the 2400-to-2200-area or lower.


