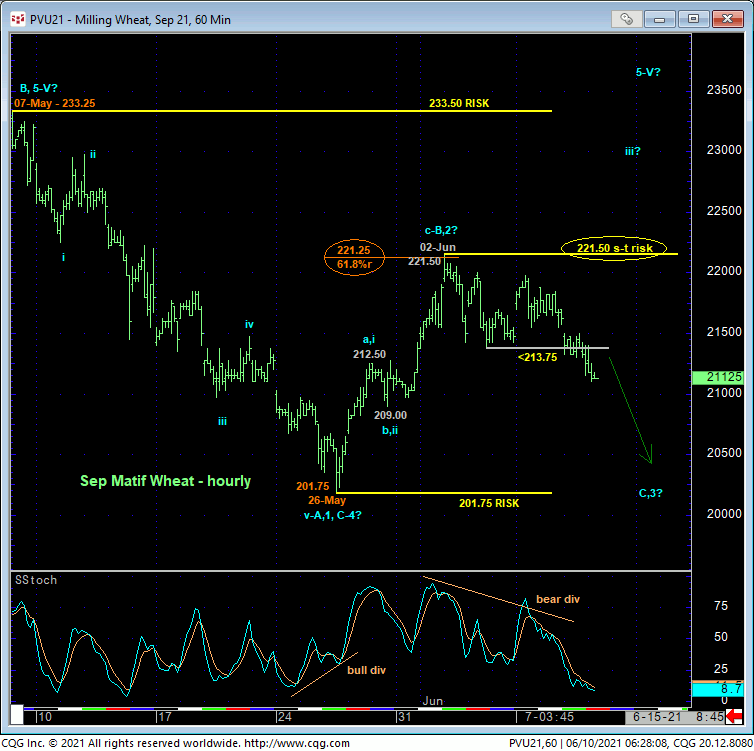
The hourly chart below shows the past couple days’ slip below 03-Jun’s 213.75 initial counter-trend low. This confirms a bearish divergence in short-term momentum that defines 02-Jun’s 221.50 high as the END of the recovery attempt from 26-May’s obviously critical 201.75 low. Moreover, by virtue of this short-term mo failure, that recovery from 201.75 to 221.50 looks to be a textbook 3-wave and thus corrective affair, stalling within a tick of the (221.25) 61.8% retrace of May’s 233.25 – 201.75 textbook 5-wave decline. Combined with mid-May’s bearish divergence in daily momentum, this satisfies our three key reversal requirements and warns of a resumption of May’s downtrend to levels potentially well below 26-May’s 201.75 key low and long-term risk parameter. Per these events, 02-Jun’s 221.50 high now serves as a short-term but pivotal risk parameter from which non-bullish decisions like long-covers and bearish punts can now be objectively based and managed.

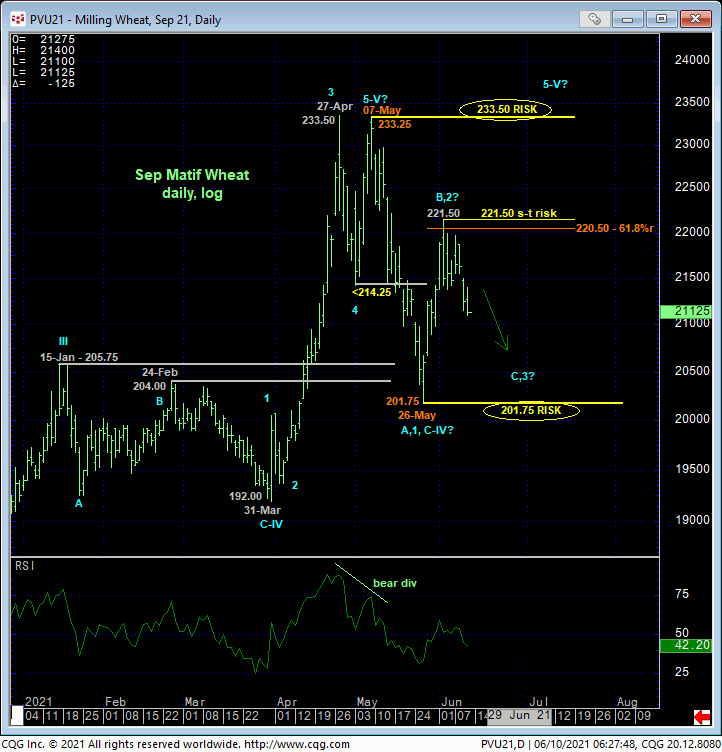
From a scale perspective, it’s important to understand that the admittedly shorter-term weakness discussed above comes within the longer-term construct of an bearish divergence in DAILY momentum from 17-May shown in the daily log scale chart below. In 17-May’s Technical Blog, we specifically discussed this market’s completion of two of our three key reversal requirements: a confirmed bearish divergence in momentum and proof of trendy, impulsive, 5-wave-looking behavior on that initial (A- or 1st-Wave) decline. Now, as a result of the past couple days’ slip below 213.75, the market has arguably satisfied the critical third reversal requirement. If correct, this count calls for a sharp, sustained (C- or 3rd-Wave) decline to levels well below 26-may’s 201.75 low and key long-term risk parameter.
As important as this bearish prospect is the specific DEFINITION OF RISK at 221.50, or the level this market now needs to recoup to nullify this count. Until and unless such 221.50+ strength is proven, further and possibly steep, accelerated losses should not surprise.


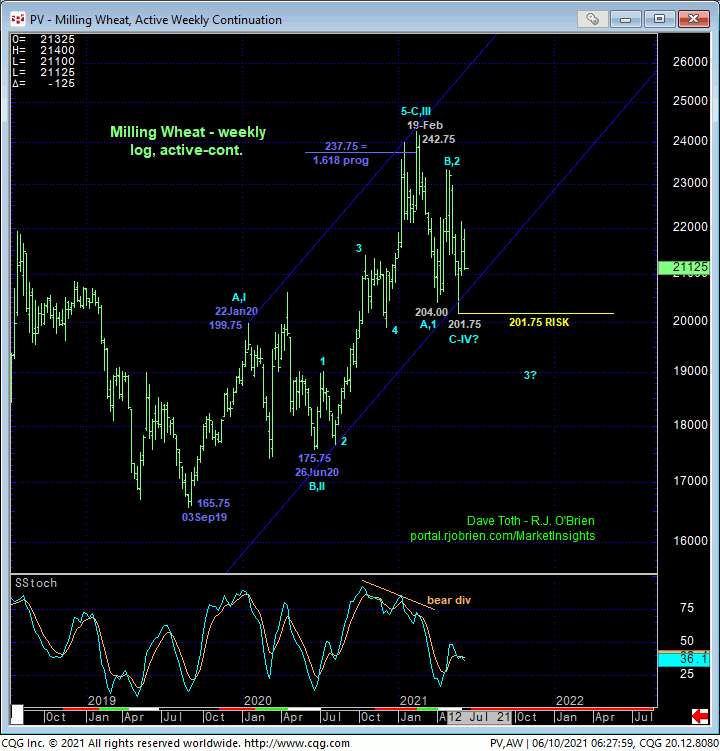
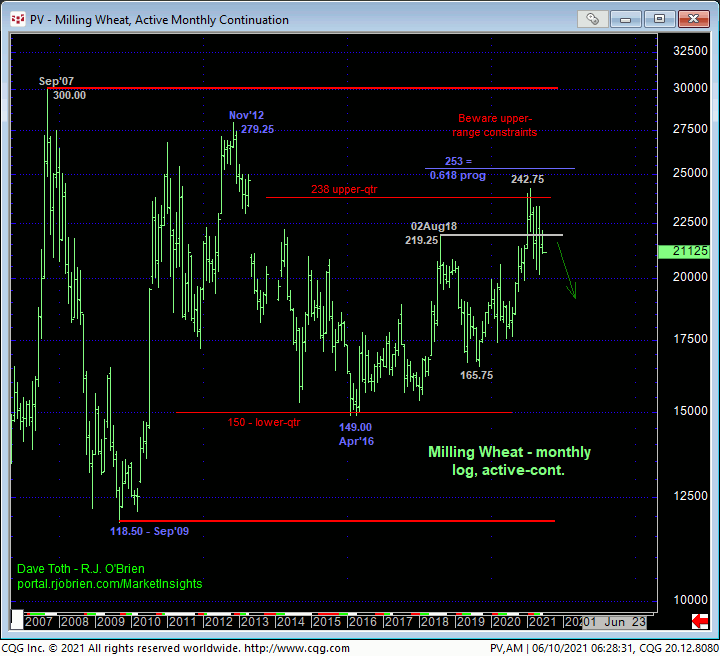
From an even longer-term perspective, we cannot ignore the past few months’ setback as a very long-term bull market correction per the weekly log active-continuation chart above. By the same token however, looking at the monthly log chart below, this market has thus far rejected the upper-quarter of its massive, lateral range where a return to the middle-half bowels of this range (200-to-175 or lower) in the months and quarters ahead should also not come as a surprise.
These issues considered, both shorter-term traders and longer-term commercial players are advised to move to a cautious bearish policy and exposure from 212.00-area prices OB with a recovery above 221.50 required to negate this call and warrant its cover. In lieu of such strength, further and possibly protracted losses are expected.


