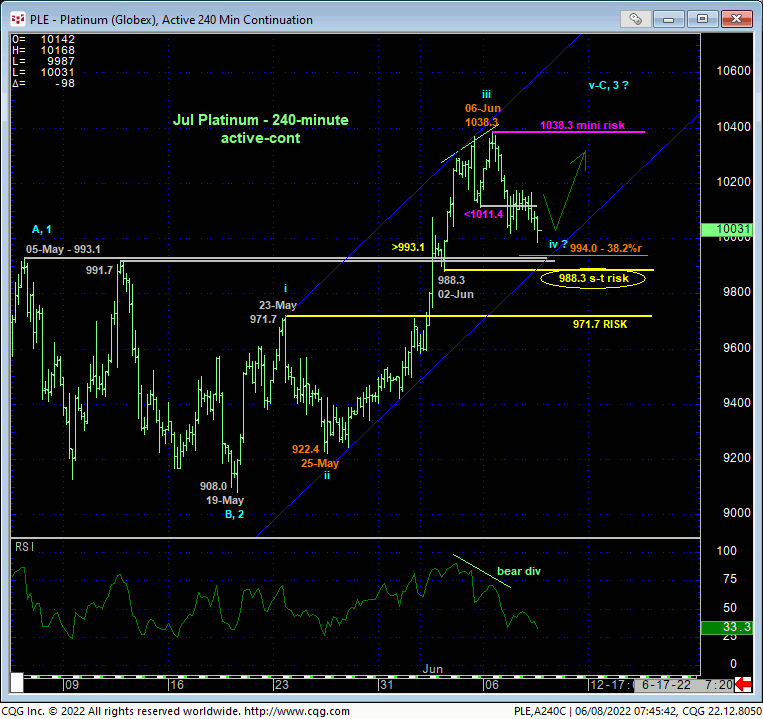
Last week’s sharp rally and continuation of what is now is nearly a month-and-a-half recovery is this market’s best performance since Dec-Mar’s $311, 35% rally. Yesterday’s slip below a very minor corrective low at 1011.4 from last Fri confirms a bearish divergence in very short-term momentum and defines Mon’s 1038.3 high as one of developing importance and a mini risk parameter from which non-bullish decisions like long-covers can be objectively based and managed by very short-term traders.
Given the market’s position still above a relative ton of former resistance-turned-support around the 992-handle detailed in the 240-min chart below however, as well as the (994) 38.2% retrace of the suspected 3rd-Wave rally from 25-May’s 922.4 low to 1038.3, we believe this week’s setback attempt is of too small a scale to be considered as anything else but a (4th-wave) correction of an eventual 5-wave rally from 19-May’s 908 low that still has one more round of (5th-wave) gains ahead. Per such, we’re defining 02-Jun’s 988.3 low as our short-term risk parameter this market needs to fail below to threaten this count enough for most traders to pare or neutralize a cautious bullish policy.


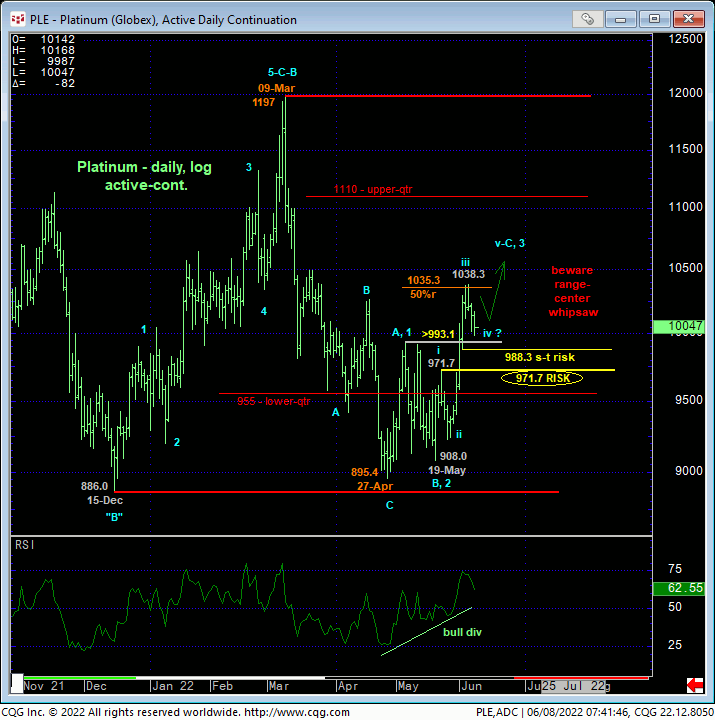
Stepping back a bit, perhaps the biggest threat to a bullish count is the market’s return to the smack-dab middle of a range that has constrained it for nearly a year and where the odds of aimless whipsaw risk are approached as higher, warranting a more conservative approach to directional risk assumption. To negate the impulsive integrity of a suspected 5-wave Elliott sequence up from 19-May’s 908 low, this market needs to fail below 23-May’s 971.7 suspected 1st-Wave high. Per such, we’re defining this level as our key longer-term bull risk parameter pertinent to longer-term commercial players.
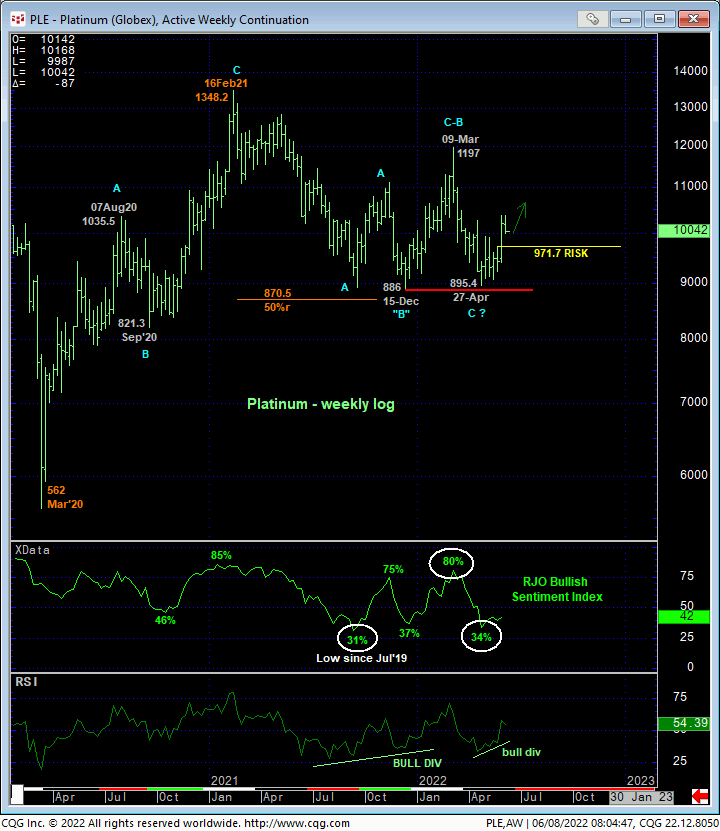
Compelling factors supporting a broader bullish count include:
- 01-Jun’s bullish divergence in WEEKLY momentum (below) amidst
- a return to historically bearish levels in our RJO Bullish Sentiment Index and
- the market’s clear rejection of the extreme lower recesses of the multi-quarter lateral range.
To maintain a broader bullish count however, as opposed to a mere continuation of the multi-quarter lateral chop, it is imperative for the bull to BEHAVE LIKE ONE with sustained, trendy, impulsive behavior higher. A failure below 971.7 would mitigate such a bullish count and warrant a return to a neutral/sideline policy.

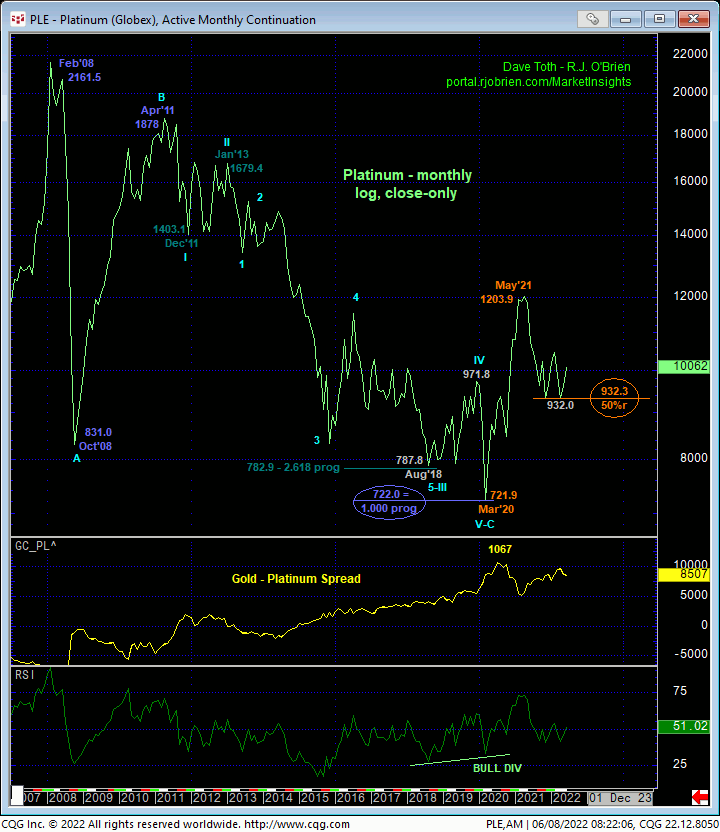
One final thought. We find some acute Fibonacci relationships astounding on a very long-term monthly log close only basis below that may or may not have any bearing on our analysis above at all but is worth noting. It is astounding that:
- the entire C-Wave resumption of the bear market from Apr’11’s 1878 B-Wave high spanned an identical length (i.e. 1.000 progression) to Feb-Oct’08’s initial A-Wave decline from 2161 to 831
- of the decline from Apr’11’s 1878 high, the major 3rd-Wave down from Jan’13’s 1679 high came within $5-bucks of the (782.9) 2.618 progression of Apr-Dec’11’s 1st-Wave decline from 1878 to 1403
- and while not denoted in the chart below, since this massive 2013 – 2018 3rd-Wave decline “extended”, the major 5th-Wave down from Dec’19’s 971.8 high came within $4-bucks of equally Wave-1’s 1878 – 1403 decline (1.000 progression).
The reason these past Fibonacci progression relationships MAY have some bearing on a longer-term bullish count is that Apr’22’s 932.0 low monthly close is just 30-CENTS away from the (932.3) 50% retrace of Mar’20 – May’21’s 721.9 – 1203.9 rally. Crazy, right?
In sum, the extent of the past month-and-a-half’s recovery from 27-Apr’s 895.4 low and rejection of the extreme lower recesses of the multi-quarter lateral range has got to be taken as technically constructive. The risk/challenge to a bullish policy however is the market’s return to the middle-half bowels of this multi-quarter lateral range where the odds of aimless whipsaw risk are advised to approached as higher, warranting a more conservative approach to risk assumption. Against this backdrop, it would be a mistake to approach this market aggressively bullish, relying on a sustained bullish count from current conditions. This said, until and unless this market fails below at least 988.3 and preferably 971.7, further and possibly accelerated gains should not surprise, especially with market sentiment/contrary opinion levels back near historic lows. A recovery above Mon’s 1038.3 high will reinforce this count and call.


