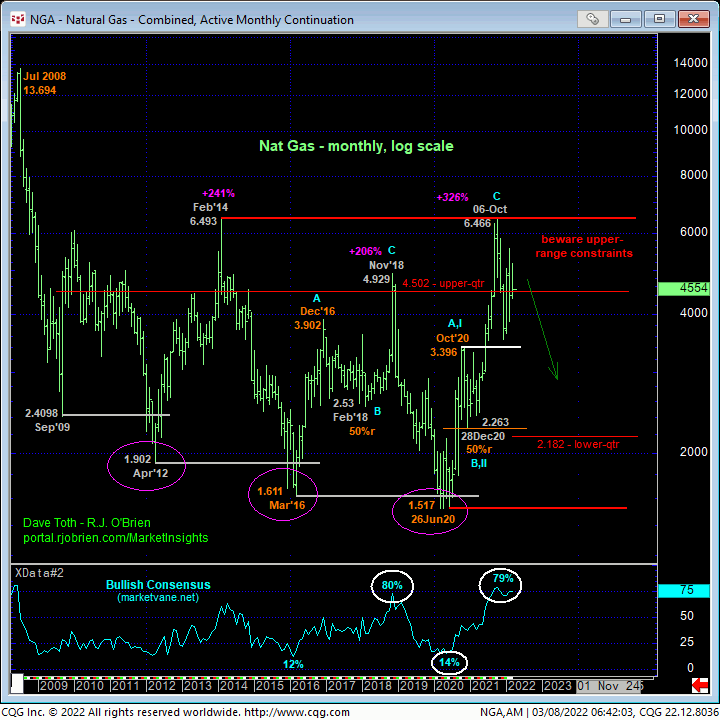
The market’s gross failure yesterday to sustain its gains above former 5.05-to-4.93-area resistance-turned-support and this morning’s failure below our 4.628 short-term risk parameter discussed in yesterday’s Technical Blog confirms a bearish divergence in short-term momentum. This mo failure defines yesterday’s 5.184 high as one of developing importance and our new short-term risk parameter from which non-bullish decisions like long-covers and cautious bearish punts can now be objectively based and managed.
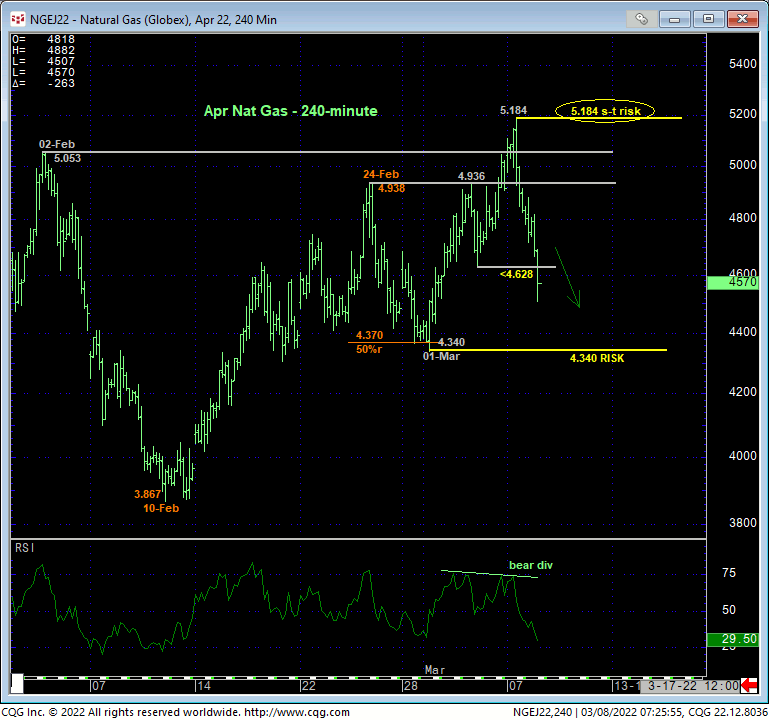
As we cannot conclude a broader top from proof of just short-term weakness, attention now focuses on 01-Mar’s 4.340 larger-degree corrective low and key longer-term risk parameter this market needs to sustain gains above to maintain the broader uptrend from at least 10-Feb’s 3.867 low and possibly from 30-Dec’s 3.384 low in the Apr contract. A failure below 4.340 would confirm a bearish divergence in DAILY momentum and contribute larger-degree evidence of weakness and vulnerability that, against our long-term peak/reversal-threat backdrop, could shock many traders with lower gas prices in the face of the Russian/Ukraine conflict.
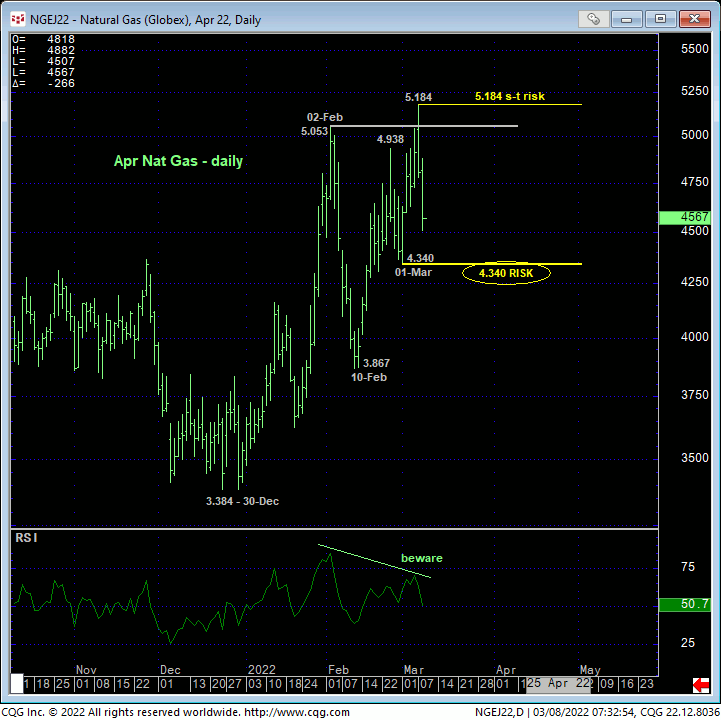
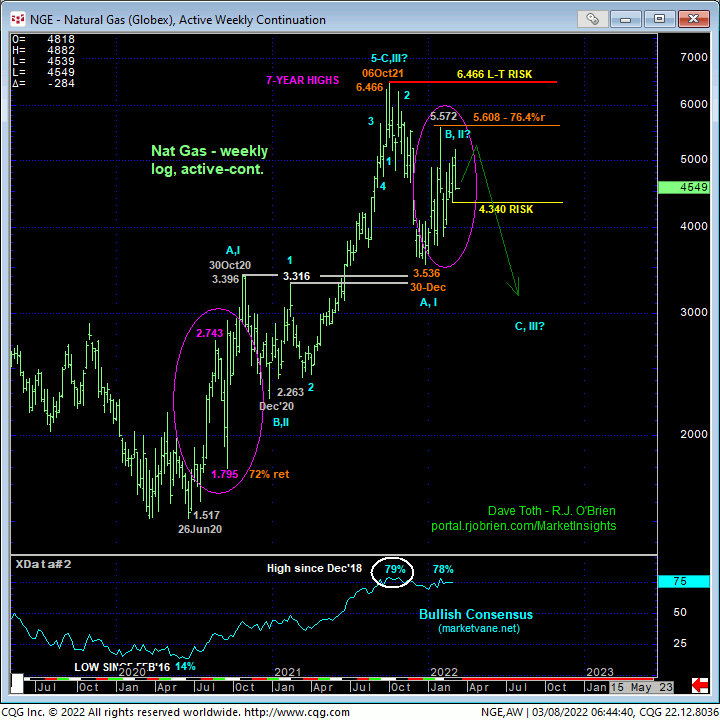
The technical elements warning of this broader peak/reversal-threat process are detailed in the weekly log chart of the Apr contract above and weekly log active-continuation chart below and include:
- waning upside momentum in the Apr contract on a major weekly scale
- the
prospect that this week’s 5.184 high might have completed a textbook and massive
5-wave Elliott sequence from Mar’20’s 2.176 low where
- the suspected 5th-Wave up from Dec’s 3.384 low came within a penny-and-a-half of the (5.200) 0.618 progression of the net distance of Waves-I-thru-III (2.176 – 4.363)
- historically frothy levels in the Bullish Consensus (marketvane.net) measure of market sentiment
- the recovery from 30-Dec’s low on an active-continuation basis below that, because it remains far shy of Oct’s 6.466 high, remains well within the bounds of a mere (B- or 2nd-Wave) correction within a major peak/reversal process we’ve been touting since
- last Nov’s bearish divergence in WEEKLY momentum that, in fact, broke the major uptrend from at least Dec’20’s 2.263 low and possibly completed a major 3-wave correction from Jun’20’s 1.517 low.
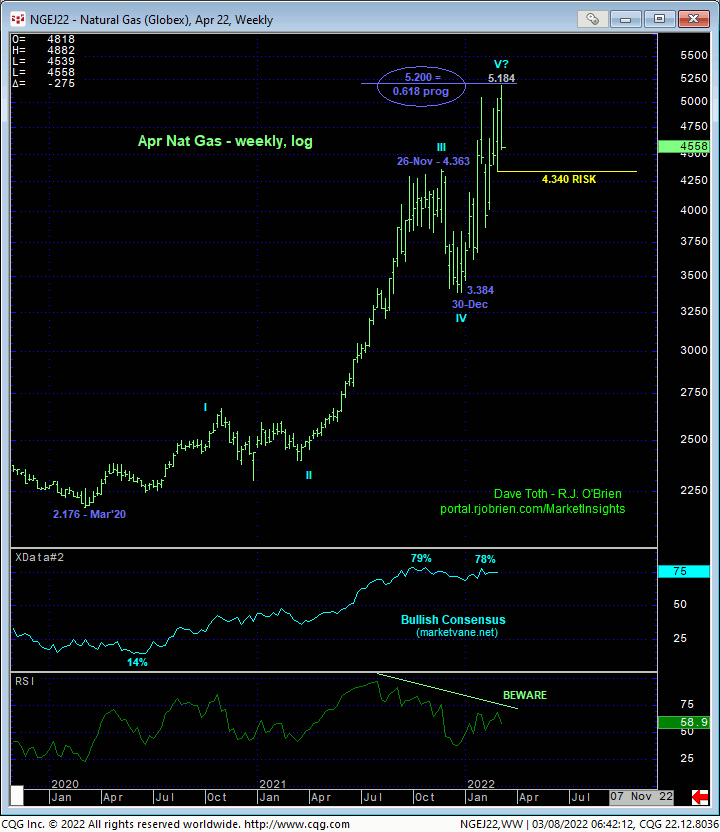
Finally, on an even broader basis, the monthly log chart below shows the market’s thus far rejection of the upper-quarter of its massive historical lateral range that dates back 12 YEARS where the bull’s struggles have been fully acknowledged. IF the price action from last Oct’s high is “just” a correction within some mega-bull trend that’s going to eventually blow out that 6.466 high, then this bull needs to BEHAVE LIKE ONE “UP HERE” by sustaining trendy, impulsive and increasingly obvious price action higher and, first, breaking 02-Feb’s 5.572 high in the then-prompt Mar contract and ultimately last Oct’s 6.466 high in the then-prompt Nov21 contract. This morning’s admittedly short-term bearish divergence in mo below 4.628 is the first strike against such a bullish count. Subsequent weakness below 01-Mar’s 4.340 larger-degree corrective low and key risk parameter will be the next.
These issues considered, shorter-term traders have been advised to move to a neutral/sideline position as a result of this morning’s mo failure below 4.628. A recovery above 5.184 is required to negate this call, reinstate the bull and expose potentially sharp gains thereafter. Longer-term commercial players remain OK to maintain a bullish policy with a failure below 4.340 required to negate this call, warrant its immediate cover ahead of a reversal lower that, again, given the conflict in Ukraine, could surprise many.
