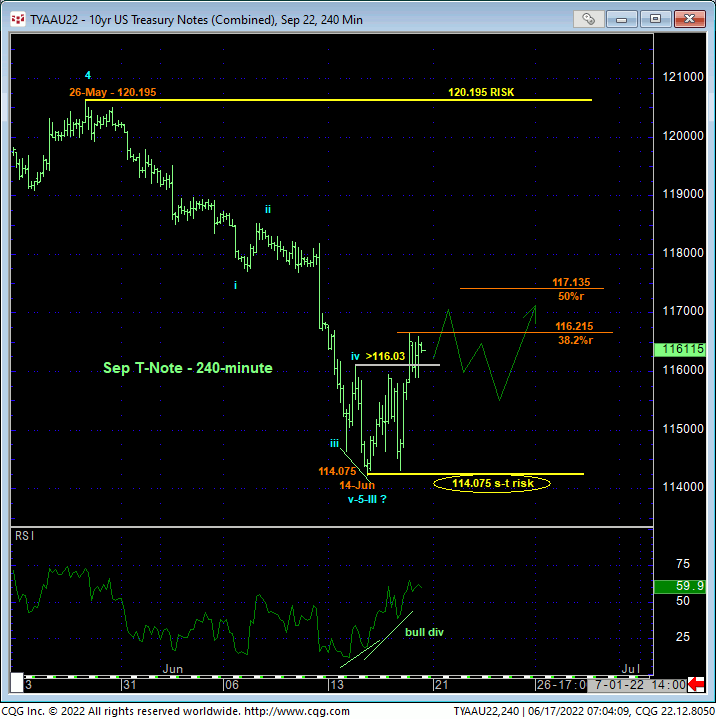
Yesterday’s recovery above Tue’s 116.03 minor corrective high and short-term risk parameter discussed in Wed’s Technical Blog confirms a bullish divergence in short-term momentum and defines Tue’s 114.075 low as the end of the decline from 26-May’s 120.195 larger-degree corrective high in the Sep contract. As a direct result of this short-term momentum failure, shorter-term traders with tighter risk profiles have been advised to take profits on previous bearish exposure and move to a neutral/sideline position in order to circumvent the heights unknown of at least an intermediate-term and possibly a major correction higher. In this regard, Tue’s 114.075 low serves as our new short-term risk parameter from which such non-bearish action like short-covers and cautious bullish punts can now be objectively based and managed.
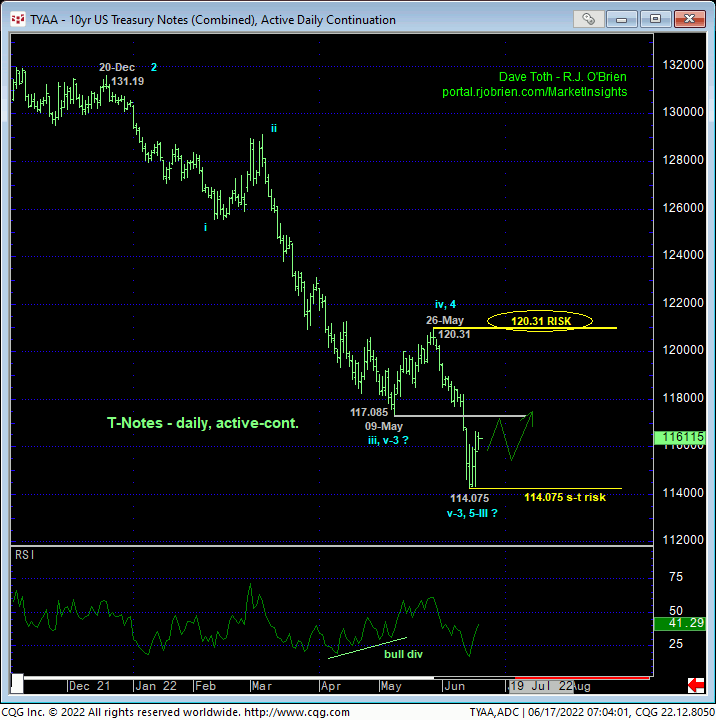
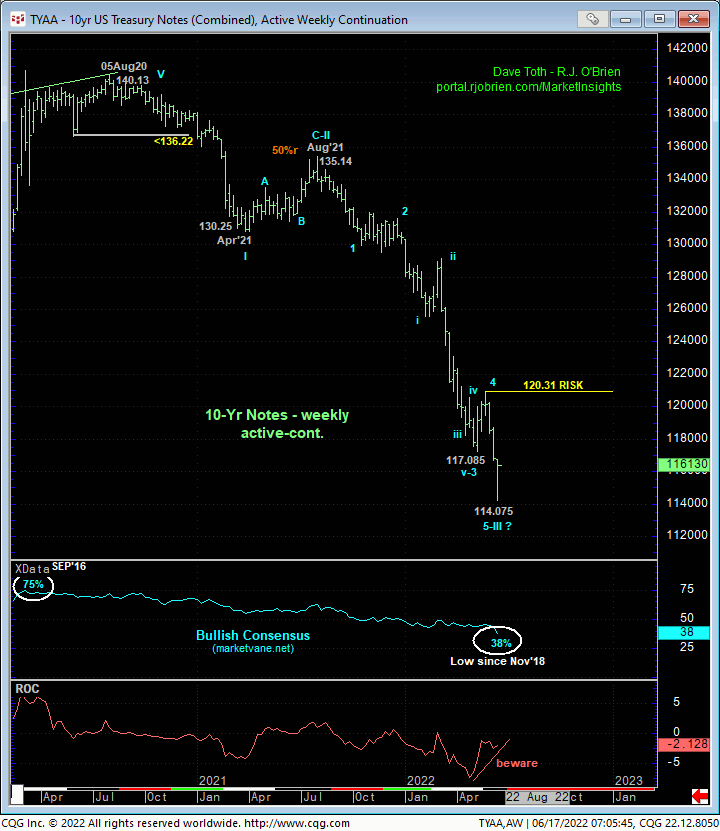
On a long-term basis, yesterday’s bullish divergence in short-term momentum is of an insufficient scale to conclude anything more than another interim correction within the ongoing secular bear trend. The daily (above) and weekly (below) active-continuation charts still show the market below even former 117-1/4-area support-turned-resistance, let alone 26-May’s 120.31 larger-degree corrective high and key long-term risk parameter this market is required to recover above to, in fact, break the secular bear trend. In effect, the short-to-intermediate-term trend is up within a still-arguable major bear trend where the technical and trading issue of SCALE risk assumption commensurate with one’s personal risk profile becomes a point of emphasis. If you’re a shorter-term trader, the market has recovered enough to question a continued bearish policy, warranting a move to the sidelines. If you’re a longer-term institutional players, the market has not provided the evidence necessary to neutralize exposure. Longer-term players do have the option however of paring bearish exposure to more conservative levels and acknowledging and accepting whipsaw risk, below 114.07, in exchange for steeper nominal risk above 120.31.
If the expected rebound is just a slightly larger-degree bear market correction, we would expect the recovery attempt to be stemmed by a countering bearish divergence in short-term momentum from some level shy of 120.31. Such a mo failure will reject/define a more reliable high and resistance from which resumed bearish decisions can be objectively rebased and managed. Needless to say, a relapse below 114.075 mitigates any larger-degree base/correction/reversal count, reinstates the bear and exposes potentially steep losses thereafter, warranting a return to a bearish policy by shorter-term traders.
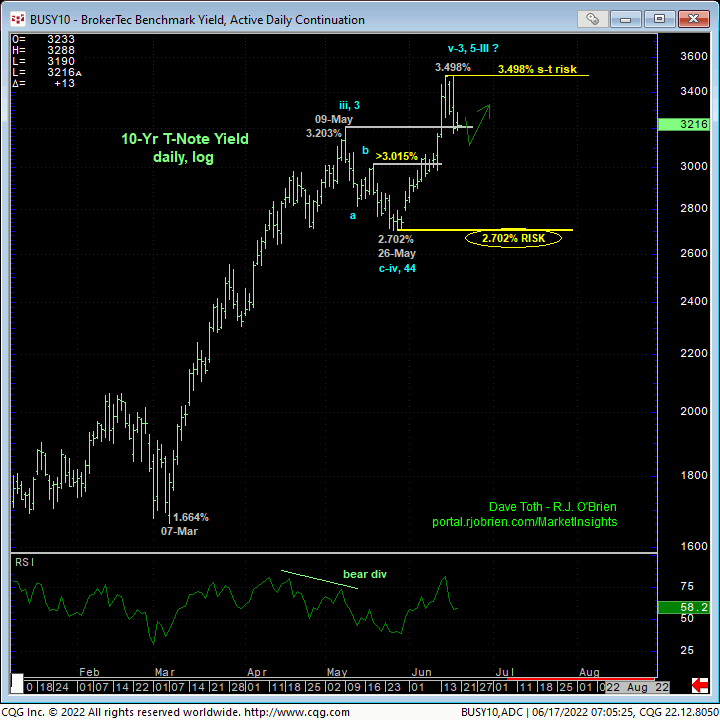
From a 10-yr yield perspective shown in the daily log chart below, the key short- and long-term flexion points and risk parameters are defined by Tue’s 3.498% high and 26-May’s 2.702% low, respectively.