Posted on Oct 27, 2022, 06:49 by Dave Toth
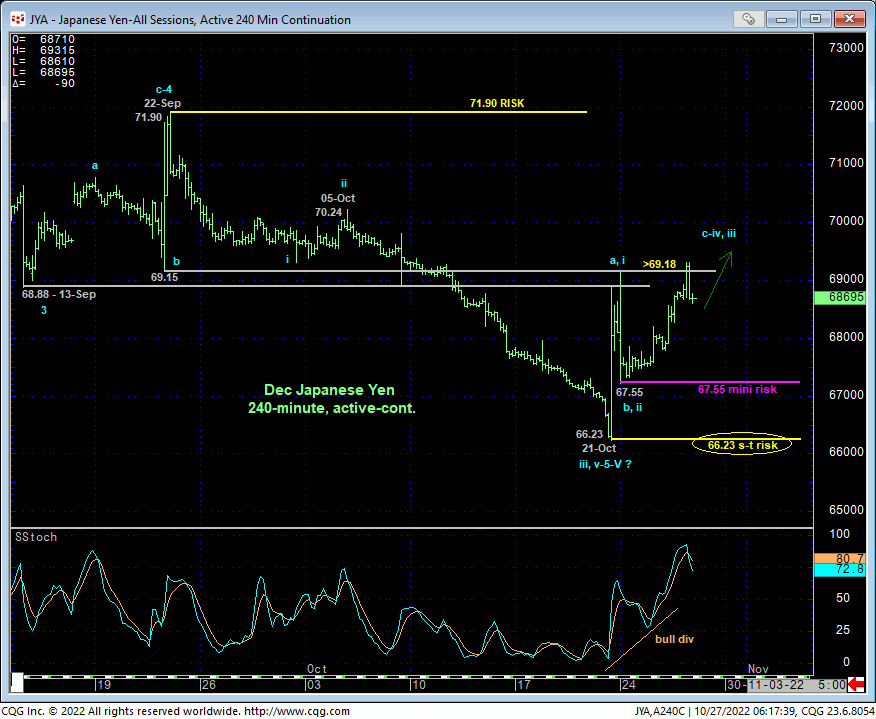
Overnight’s poke above Mon’s 69.18 initial counter-trend high and our short-term risk parameter discussed in Mon’s Technical Webcast confirms a bullish divergence in short-term momentum. This short-term momentum failure is detailed in the 240-min chart below that also shows two lows and support at 67.55 and 66.23 that this market would now be expected to sustain gains above IF this week’s price action is part of a larger-degree correction or reversal higher. A relapse below 67.55 will render this recovery attempt a 3-wave and thus corrective affair that would re-expose the secular bear trend, while subsequent weakness below 66.23 will obviously confirm such. Until and unless such weakness is regenerated, and especially if this market can start sustaining gains into a 70- and 71-handle, we cannot ignore the past couple days’ gains as part of something bigger to the upside. Per such, 67.55 and 66.23 are considered our new mini and short-term risk parameters from which non-bearish decisions like short-covers can be objectively based and managed by shorter-term traders with tighter risk profiles.
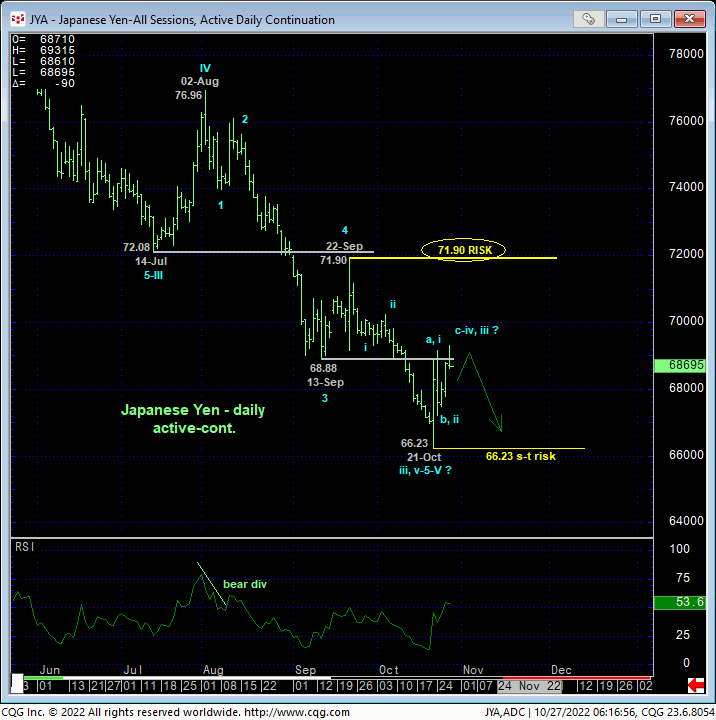
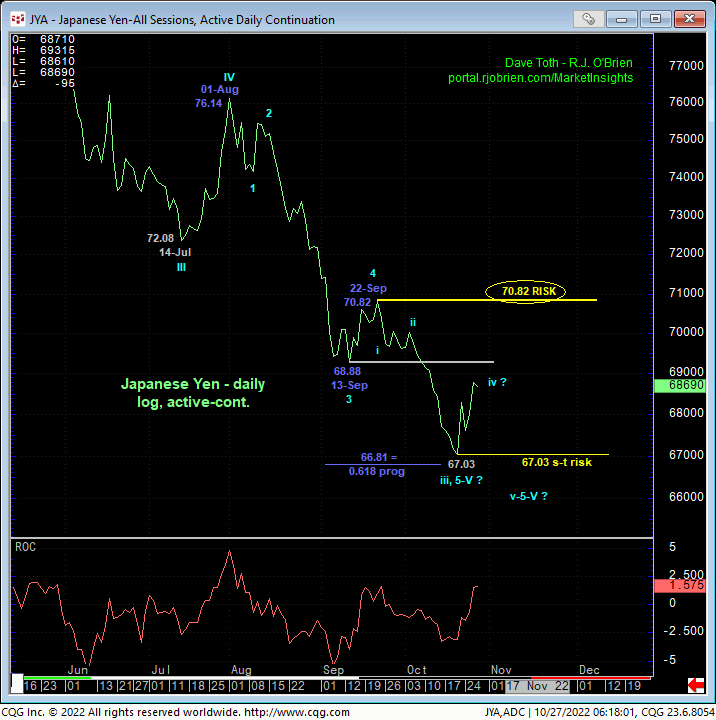
This said, from a longer-term perspective, the recovery from last Fri’s 66.23 intra-day low and last Thur’s 67.03 low close remains well within the bounds of another mere correction within the secular bear trend, with former Sep support around the upper-68-handle-area still intact as a new resistance candidate. As recently discussed and as shown in both these charts, there’s clearly the chance that the resumed secular bear trend from 22-Sep’s 71.90 intra-day high and 70.82 close is the completing 5th-Wave of not only an Elliott sequence down from 02-Aug’s high, but also a massive sequence down from Jan’21’s 97.55 shown in the weekly log chart further down. However, the current recovery attempt from last week’s low is thus far of an insufficient SCALE to conclude such a completion. Commensurately larger-degree strength above 22-Sep’s larger-degree corrective highs at 71.90 and/or 70.82 remains required to confirm a bullish divergence in momentum of a scale sufficient to break even Aug-Oct’s portion of the secular bear market, let alone threaten the very long-term secular bear. In effect, we have yet another not uncommon situation where the short-to-intermediate-term trend is up within the still-arguable long-term downtrend, with 70.82, 67.55 and 66.23 the pertinent flexion points around which to toggle directional biases and exposure commensurate with one’s personal risk profile.
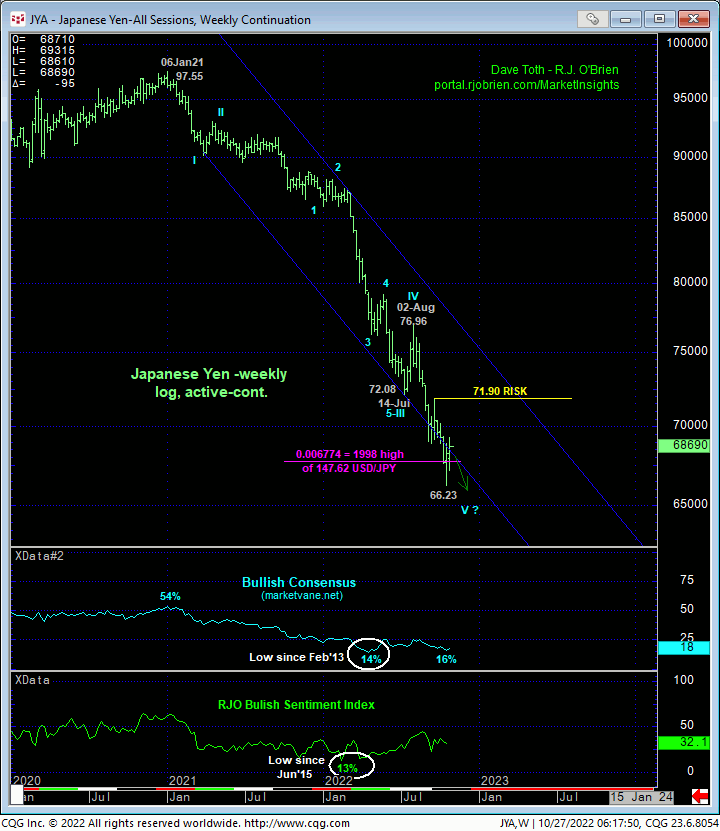
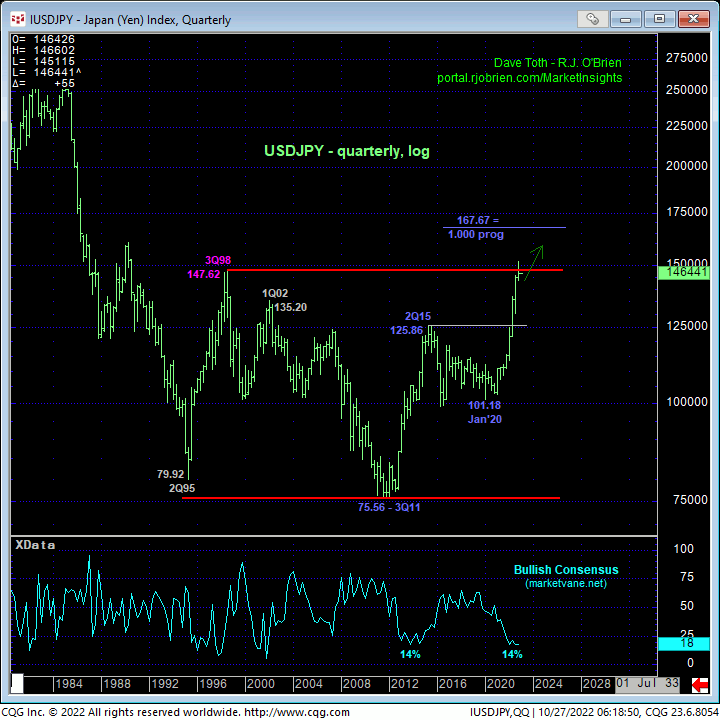
Stepping back further, the weekly log chart of the contract above and quarterly log chart of the cash USDJPY market below show the sheer magnitude of the secular bear market in the yen. This downtrend is a dominant technical element that, minimally, requires a recovery above 22-Sep’s 71.90 larger-degree corrective high to even defer, let alone threaten this monster bear. The market’s proximity to 3Q1998’s 147.62 high in the USD, understandably historically low, bearish levels in the Bullish Consensus (marketvane.net) and the POSSIBILITY that the market might be close to finishing a massive Elliott Wave sequence are certainly factors that warrant close watch as major base/reversal-threat elements. But the simple fact of the matter is that this market has yet to break the major but simple downtrend pattern of lower lows and lower highs on a scale sufficient to threaten the bear. Herein lies the importance, from a longer-term perspective, of 22-Sep’s 70.82 larger-degree corrective high close and/or that day’s 71.90 intra-day high. Until and unless this market can recoup these levels, the long-term trend remains down.
These issues considered, shorter-term traders have been advised to move to a neutral/sideline position as a result of overnight’s recovery above 69.18. A relapse below 67.55 will threaten this call and re-expose the secular bear while subsequent weakness below 66.23 will confirm such and warrant a return to at least a cautious bearish policy. A bearish policy and exposure remain advised for longer-term institutional players with a close above 70.82 and/or an intra-day recovery above 71.90 required to negate this call and warrant its cover.
