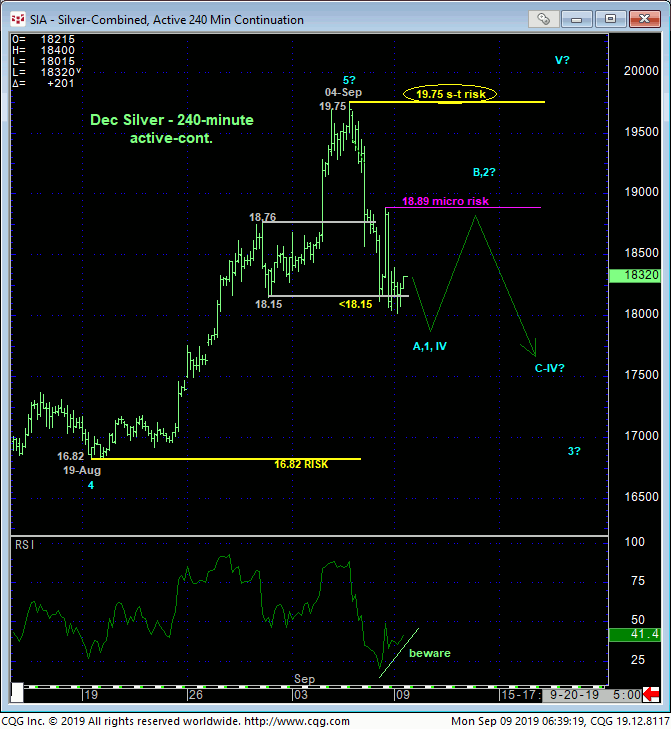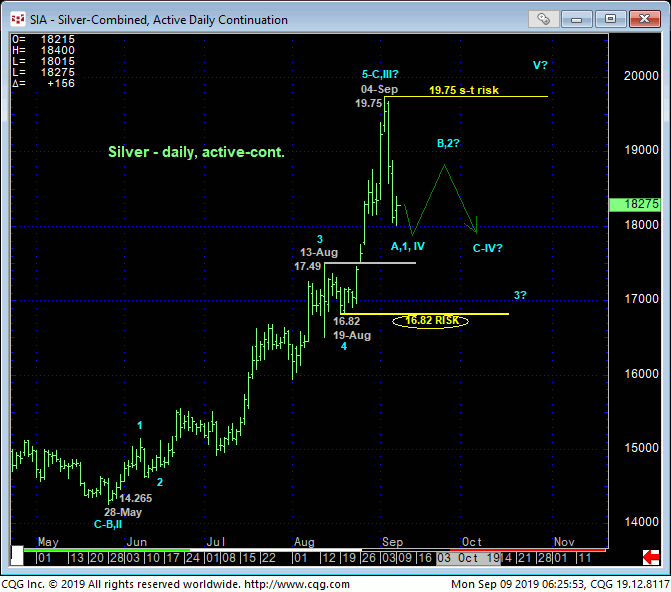
The market’s failure Fri and overnight below 29-Aug’s 18.15 smaller-degree corrective low discussed in 03-Sep’s Technical Webcast obviously breaks the uptrend from 19-Aug’s 16.82 low and defines 04-Sep’s 19.75 high as one of developing importance and our new short-term risk parameter from which non-bullish decisions like long-covers and cautious bearish punts can now be objectively based and managed. Given the magnitude of an intra-four-year-range yet accelerating and very impressive uptrend however, it’d be premature at this juncture to conclude anything more than an intermediate-term correction/consolidation within that uptrend to at least one more round of highs above 19.75.
Indeed, the RSI measure of momentum shows the nicely developing potential for a bullish divergence in momentum that will be confirmed on a recovery above Fri’s 18.89 high. Such an interim rebound could easily be just the (B- or 2nd-Wave) corrective rebuttal to Thur/Fri’s swoon ahead of further intermediate-term correction/consolidation lower. But after stemming the recent slide with a recovery above 18.89, there’d be no way to know that the past quarter’s raging bull isn’t just taking off again.
Corrections/consolidations versus peak/reversal processes are THE most challenging predicaments to deal with when technically analyzing a market and occur roughly 2/3rds of the time in every market and on every scale. They are not mysteries but rather facts of technical and trading life and, being well aware of and acknowledging them, warrant a more conservative approach to risk assumption until odds favor a directional resolution. Currently, a recovery above 18.89 will reject/define a tighter low and support that will take on greater bull risk relevance from a longer-term perspective. Obviously, 04-Sep’s 19.75 high is THE level the bear needs to maintain as a resistant cap to maintain a broader peak/correction/reversal count.


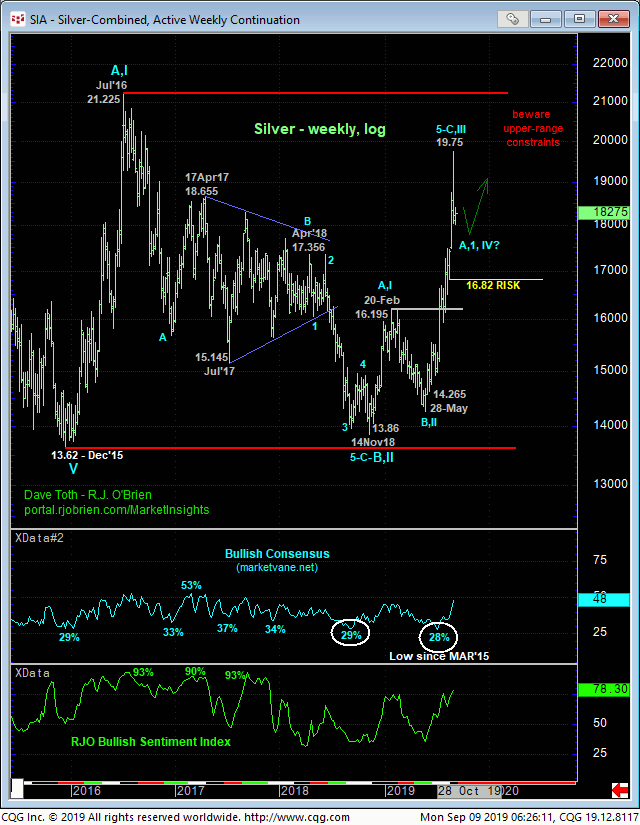
The reason we spent so much time in the introductory paragraph and short-term 240-min chart above is to stress the point about technical and trading SCALE. It’s EASY to see weakness and vulnerability on that short-term intra-day chart. But it’s a relative drop in the bucket compared to the major, impressive, impulsive, 3rd-wave-type rally that stems from 28-May’s 14.265 low shown in the weekly log chart below. On this broader scale, commensurately larger-degree weakness below 19-Aug’s 16.82 next larger-degree corrective low remains MINIMALLY required to break this long-term uptrend. It’s the extent and accelerated nature of late-Aug’s continuation of the bull that leaves so much green between 29-Aug’s smaller-degree corrective low and previous short-term risk parameter at 18.15 and that next larger-degree corrective low at 16.82.
With NO levels of any technical merit between 18.15 and 16.82, traders are forced to acknowledge and adhere to technical and trading discipline by identifying their personal risk profile relative to their trading strategy. Risking longs to 16.82 is obviously too much for shorter-term traders. By the same token, having too tight of a stop exposes longer-term players to the whipsaw risk that’s outside their risk profile, so we attempt to be as tight or as loose as is objectively possible when identifying risk parameters for both short- and longer-term traders. What we DON’T do is conjure up or put any relevance on subjective technical levels between our market-defined short- and long-term risk parameters like “derived levels” such as Bollinger Bands, imokus, trend lines, the ever-useless moving averages and even the vaunted Fibonacci relationships we cite often in our analysis. They never have been reliable reasons to buck a trend without an accompanying bulish (in this case) divergence in momentum, and they never will.
From a long-term perspective, the weekly log chart above shows the market’s engagement of the upper-quarter of a massive 4-YEAR lateral range that we’d have to acknowledge as a resistance candidate that could make the bull’s process a tougher go in the weeks or months ahead. Frankly, the 3rd-wave-type gains since early-Jul have been easy. Perhaps starting with Fri’s short-term mo failure, such gains may be tougher to come by in the weeks ahead.
These issues considered, shorter-term traders have been advised to move to a neutral/sideline position as a result of Fri’s short-term mo failure. And while that mo failure could be the start of a slightly larger intermediate-term correction or reversal lower, a bullish divergence in short-term mo anywhere around 16.00 OB could provide a favorable risk/reward condition from which to take another punt from the bull side. By the same token, a bearish divergence in mo from the lower-$19-handle would perpetuate the peak/correction/reversal-threat. Long-term players have been advised to pare bullish exposure to more conservative levels and jettison the position altogether on a failure below 16.82. Here too, a bullish divergence in short-term mo “down here” around 16.00 OB would present an opportunity to buy back the longs that were neutralize below 18.25.


