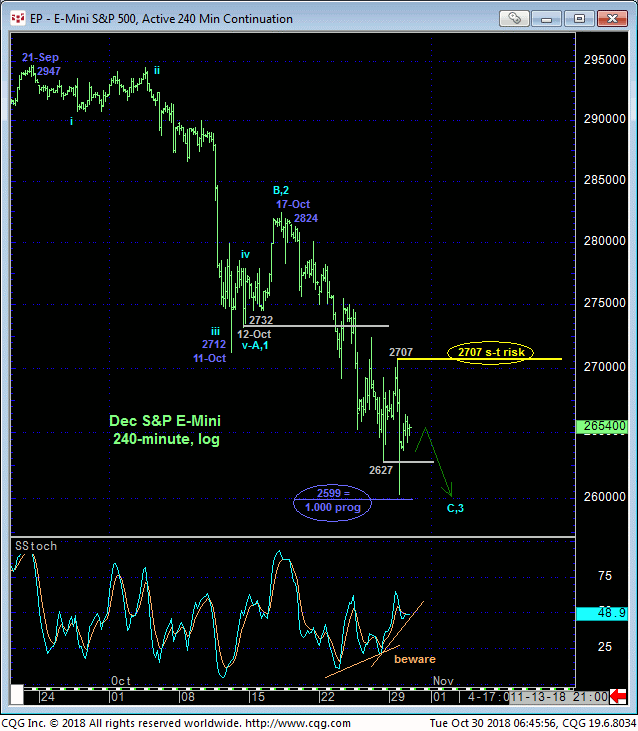
Yesterday’s continuation of this month’s collapse leaves yesterday’s 2707 high in its wake as the latest smaller-degree corrective high this market is now required to sustain losses below to maintain a more immediate bearish count. Its failure to do so will confirm a bullish divergence in momentum needed to stem the slide and reject/define a more reliable low from which non-bearish decisions like short-covers and cautious bullish punts can only then be objectively based and managed. In this regard that 2707 level becomes our new short-term risk parameter.
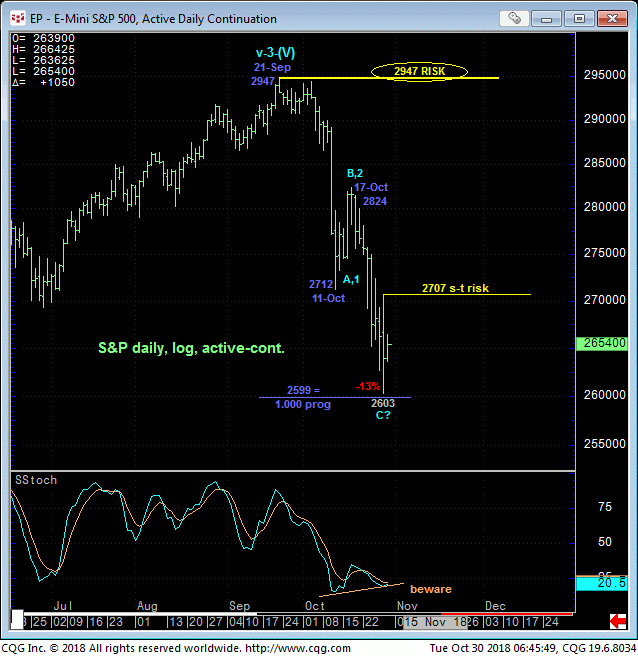
It is interesting to note that yesterday’s 2603 low came within a just four points of the (2599) 1.000 progression of the initial decline from 21-Sep’s 2947 high to 11-Oct’s 2712 low taken from 17-Oct’s 2824 corrective high. COMBINED with a confirmed bullish divergence in momentum above 2707, this Fibonacci relationship would be seen as a reinforcing factor to negotiating a reversal of this month’s decline.


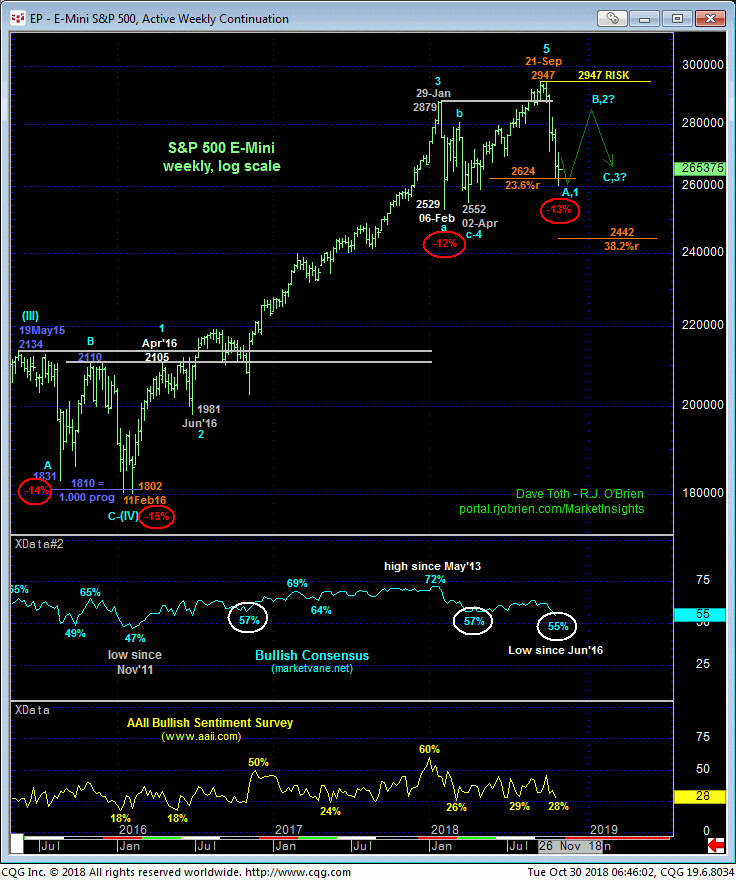
The POTENTIAL for a bullish divergence in momentum is clear in the daily chart above that also shows the decline from 21-Sep’s 2947 all-time high now reaching 13%. A quick scan of the past 3-1/2-years’ action on a weekly log scale basis below shows that this month’s decline is closing in on the limits of the past three swoons that have taken place during this time.
Market sentiment, too, has understandably taken a hit and is likely to show even lower levels when updated this week, levels that would be consistent with the ENDS or lower boundaries of major bull market corrections in the past.
But while it’s rarely hard to find such base/reversal-threat conditions while the proverbial knife is falling, traders are reminded that the technical key to navigating a bottom is MOMENTUM. Specifically, a recovery above a prior corrective high like 2707 to break the simple downtrend pattern of lower lows and lower highs and CONFIRM the signal to the point of non-bearish action like short-covers and cautious bullish punts. Until and unless this market proves strength above at least 2707, the trend remains down and should not surprise by its continuance or acceleration. Bottom-picking via option strategies like bull call spreads and call back spreads are fine because of fixed risk parameters embedded in the strategy.


