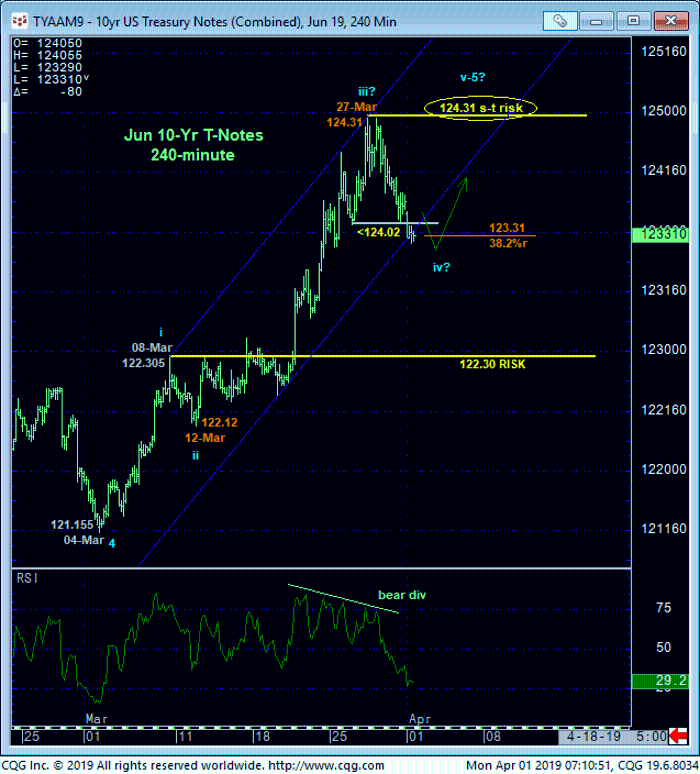
Overnight’s failure below our short-term risk parameter defined by 26-Mar’s 124.02 minor corrective low confirms a bearish divergence in short-term momentum as detailed in the 240-min chart below. This mo failure leaves 27-Mar’s 124.31 high in its wake as one of developing importance and the end of the rally from at least 12-Mar’s 122.12 low. Per such this 124.31 level is considered our new short-term risk parameter from which non-bullish decisions like long-covers and cautious bearish punts can now be objectively based and managed.
Against the backdrop of the broader uptrend and since the past few days’ relapse has thus far only retraced about 38.2% of the rally from 12-Mar’s 122.12 low, per the labeling below we suspect that last week’s 124.31 high only completed the 3rd-Wave of an eventual 5-wave sequence up from 04-Mar’s 121.155 low. A recovery above 124.41 is obviously required to confirm this count while a relapse below 08-Mar’s 122.305 (1st-Wave) high and new longer-term risk parameter is required to negate it. We will be watchful for a relapse-stemming bullish divergence in short-term mo from the upper-123-handle to reject/define a more reliable low and support from which the risk of a resumed bullish policy for shorter-term traders can be objectively rebased and managed.

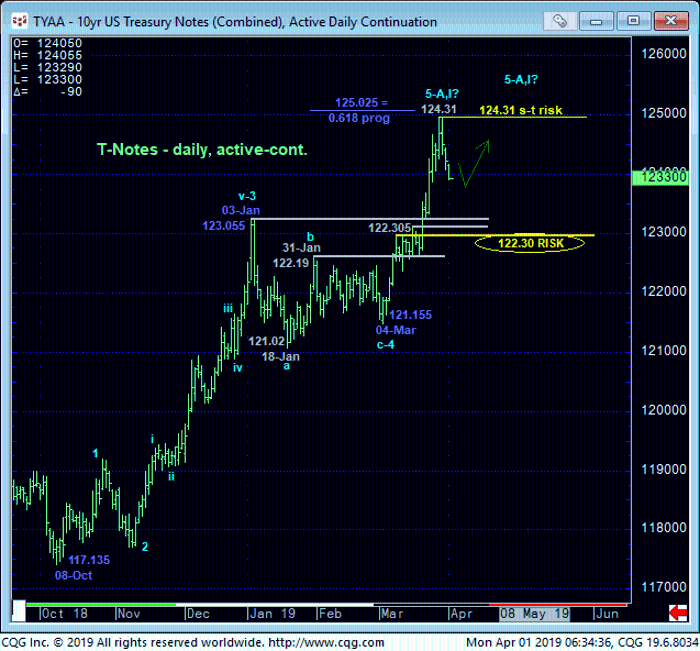
The daily chart below shows the magnitude of the broader bull trend that’s nearing six months in length and the market’s position still above a ton of former resistance from the 122.30-to-123.05-area that would fully be expected to hold as new support per any broader bullish count. This reinforces our long-term risk parameter at 122.30. This said, it is interesting to note that the suspected 5th-Wave rally from 04-Mar’s 121.155 low came within a smidge of the (125.025) 0.618 progression of Oct-Jan’s preceding 117.135 – 123.055 rally.

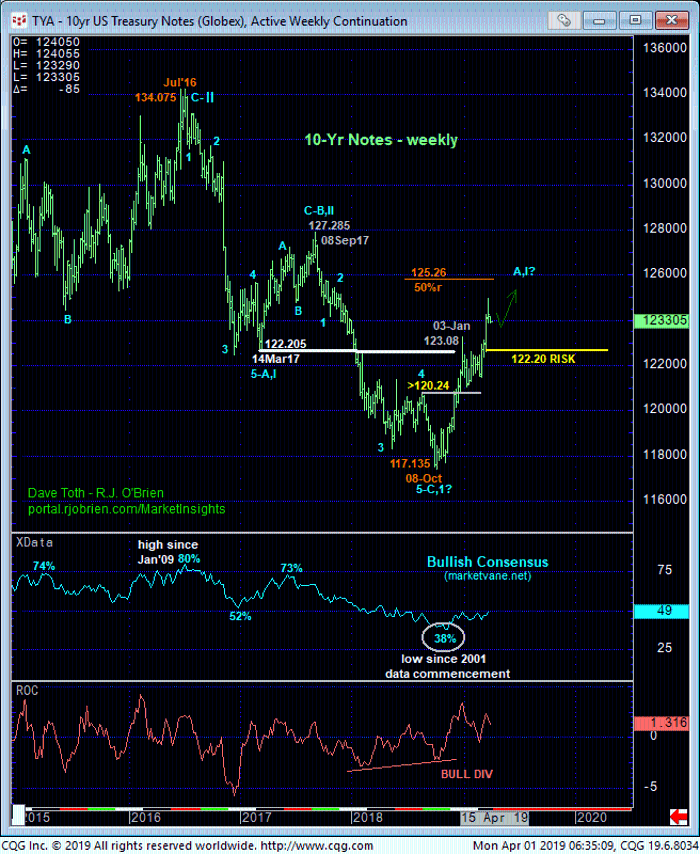
Stepping back to an even broader scale, the weekly chart below shows as big a recovery as this market has seen since the Jul’16 end to the secular bull market. Until and unless this market confirms a bearish divergence in momentum of a scale sufficient to challenge the 6-month rally with a failure below at least 122.30, longer-term players remain advised to first approach setback attempts as corrective buying opportunities.
These issues considered, shorter-term traders have been advised to move to a neutral/sideline position to circumvent the depths unknown of a suspected correction lower. Longer-term players remain advised to maintain a bullish policy with a failure below 122.340 required to negate a bullish count and warrant its cover. We will be watchful for a bullish divergence in short-term mo from the upper-123-handle for shorter-term traders to reconsider a bullish position.


