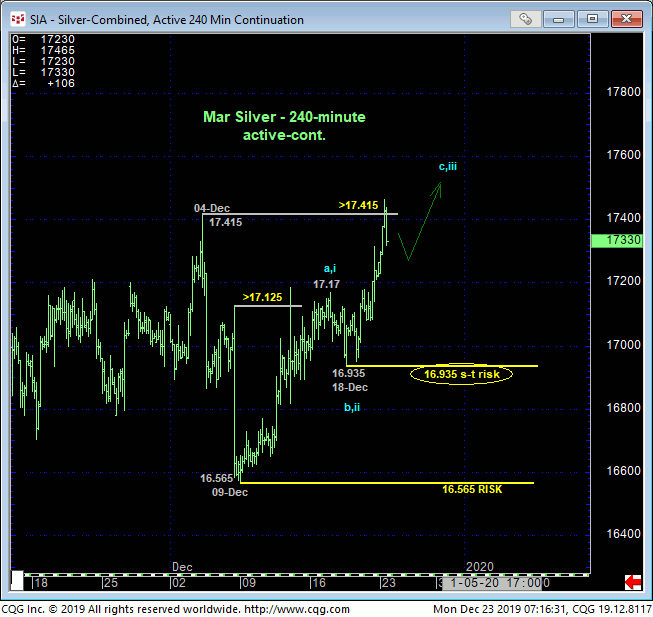
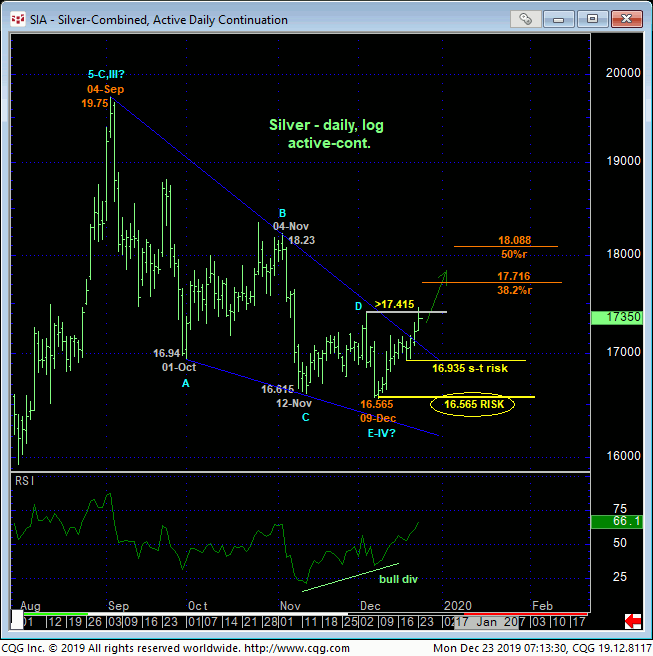
Today’s poke above 04-Dec’s 17.415 high confirms a bullish divergence in daily momentum that breaks at least the downtrend from 04-Nov’s 18.23 high and possibly the entire 3-month slide from 04-Sep’s 19.75 high. This recovery leaves smaller- and larger-degree corrective lows in its wake at 16.935 and 16.565, respectively, that now serve as our new short- and longer-term risk parameters from which non-bearish decisions like short-covers and cautious bullish punts can now be objectively based and managed.
In the daily log chart below, we’ve labeled the falling-wedge erosion from 04-Sep’s 19.75 high as a corrective 4th-Wave triangle that, if correct, should now be met with sustained, trendy, impulsive behavior higher to eventual new highs above 19.75. The market’s failure to produce such behavior would be the first indication that Sep-Dec’s erosion is a leading diagonal of a broader peak/reversal environment. Subsequent reinforcing indicators of a bearish count would be relapses below 16.935 and, obviously, 16.565. Per such, a bullish count is exposed until and unless the market fails below at least 16.935.
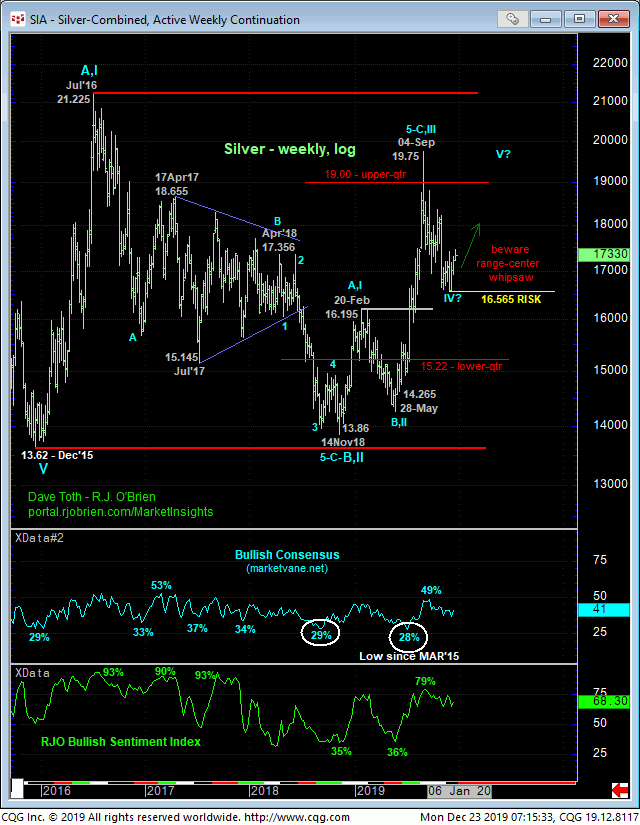
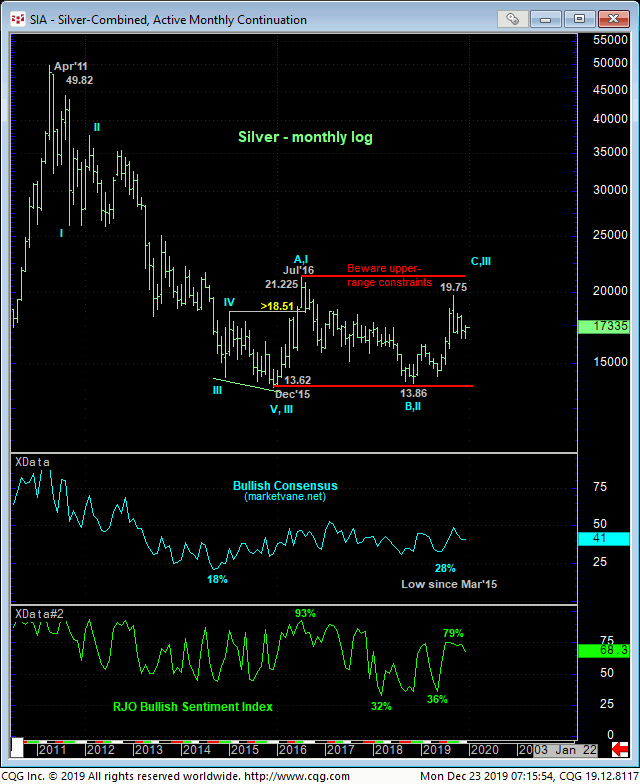
These relatively tight but objective risk parameters may come in handy given the market’s position deep within the middle-half bowels of a FOUR YEAR lateral range where we always consider the odds of aimless whipsaw risk as higher, warranting a more conservative approach to risk assumption.
These issues considered, traders are advised to move to a neutral-to-cautiously-bullish stance and first approach setback attempts to 17.27 OB as corrective buying opportunities with a failure below 16.935 required to negate this specific call and warrant its cover. In lieu of such sub-16.935 weakness, further lateral-to-higher prices are expected.