The gold/silver ratio hit all-time near-term high on March 18th at 124.18, but has since backed off a bit and is trading around 118.76. In otherwords, silver is getting a relief so to speak, relative to gold.
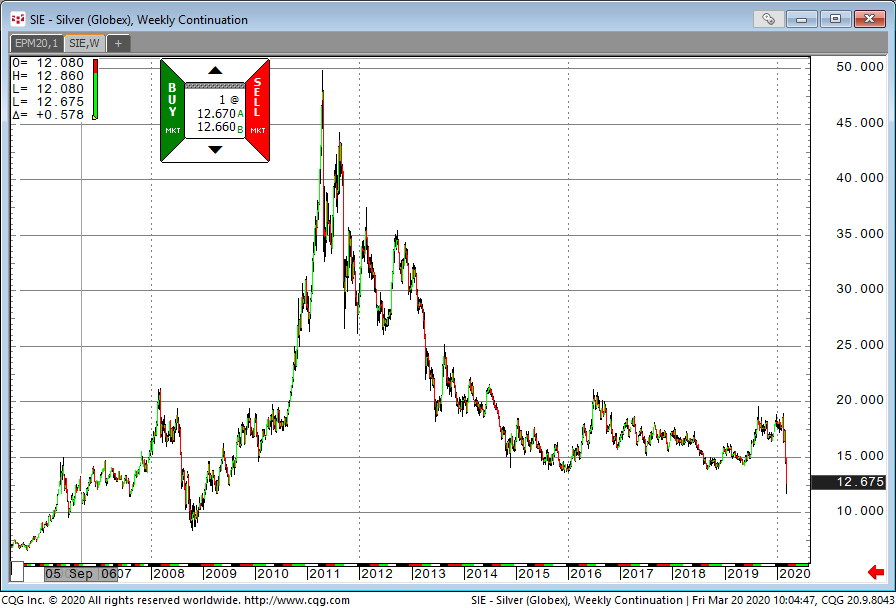
Silver made a historic 11-year contract low this week. So, in a nutshell, it has been a very strange week for silver. We haven’t see this type of price action since the week of Oct 2008 when it hit a low of $840. In my view, the price action suggesst that near term lows might not be in yet! Equities are being supported by the stimulus packages for coronavirus that the senate passed this week. A cure or some sort of vaccine could probably give markets additional boost. The chart damage on silver could take a little bit longer to improve.
From technical prosective, May silver broke out of the “inside day” chart. Support comes around 11.98 and the market is trying to break above 13.00. In my view, sideways to higher price action will proably be in order since silver is tracking the equity market. There is a general demand for commmodities acccross the board at this time.