In Thur morning’s Technical Blog we discussed the importance of the market sustaining the prior week’s rally above 21-Aug’s 2893 corrective low in order to maintain a more immediate bullish count. This requirement was particularly important given the market’s engagement of the bull-challenging upper-quarter of the past month’s range, an area that we’ve described as the “rubber-meets-the-road zone”, or the area the bull really needed to PERFORM around to maintain a more immediate bullish count.
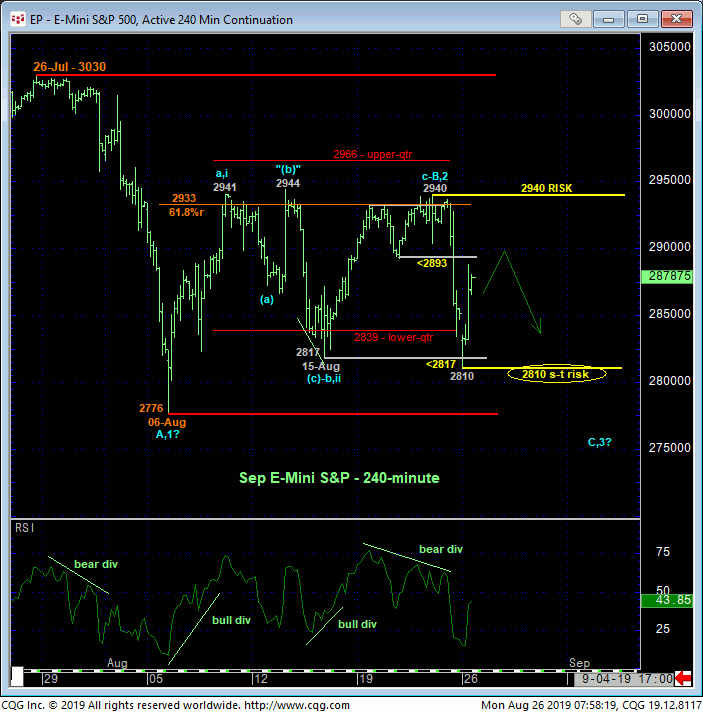
The 240-min chart below shows that the market not only failed miserably below this admittedly tight but important risk parameter, but subsequently collapsed below 15-Aug’s 2817 next larger-degree corrective low and our key longer-term risk parameter. The extent of the market’s rebound today from the lower-quarter of the past month’s range arguably identifies today’s 2810 low as one of developing importance and a short-term risk parameter from which non-bearish decisions can be objectively based and managed. But Fri’s relapse below both a smaller-degree corrective low and larger-degree corrective low cannot be ignored as a factor that contributes to the odds that the very labored, lateral recovery rom 06-Aug’s 2776 low is a 3-wave event as labeled in the 240-min chart below. Left unaltered by a recovery above Thur’s 2940 high, this labored, lateral, 3-wave recovery is considered a corrective affair that warns of a resumption of late-Jul/early-Aug’s downtrend that preceded it.


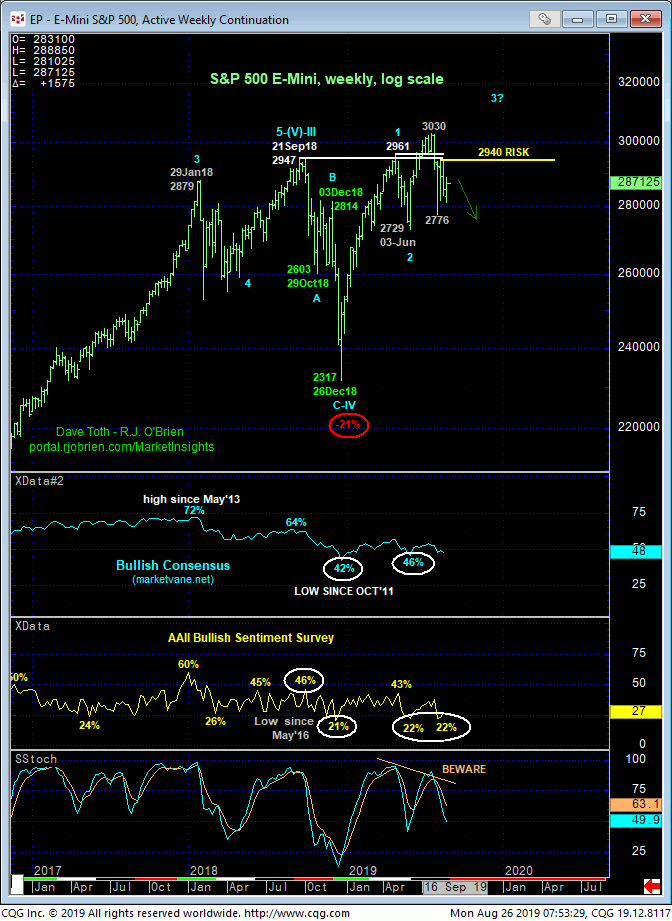
As discussed last week, this market is not totally devoid of technical elements that are still constructive, like historically bearish sentiment figures so close to an all-time high achieved only a month ago and the fact that late-Jul-/early-Aug’s plunge was virtually identical in length (i.e. 1.000 progression) to May’s preceding correction that gave way to the secular bull trend. A key difference to that May correction is that the market sustained trendy, impulsive behavior following the correction until new highs were achieved. The price action from early-Aug’s low has been anything but trendy and impulsive.
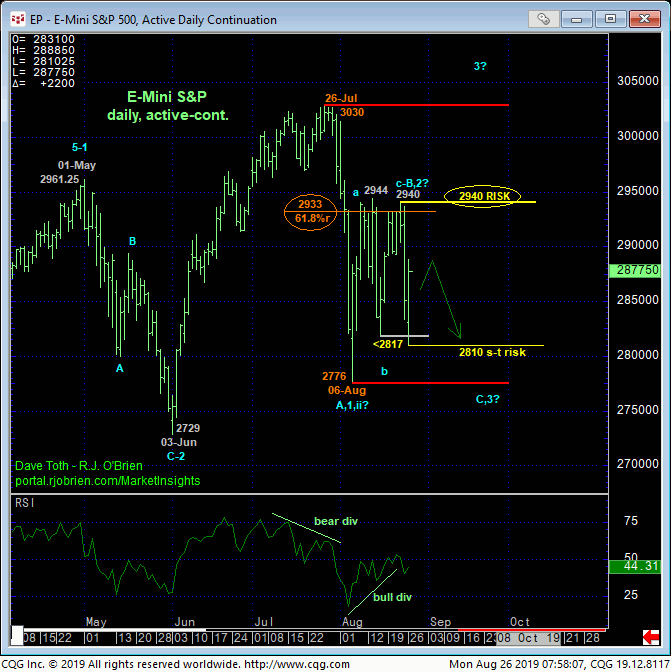
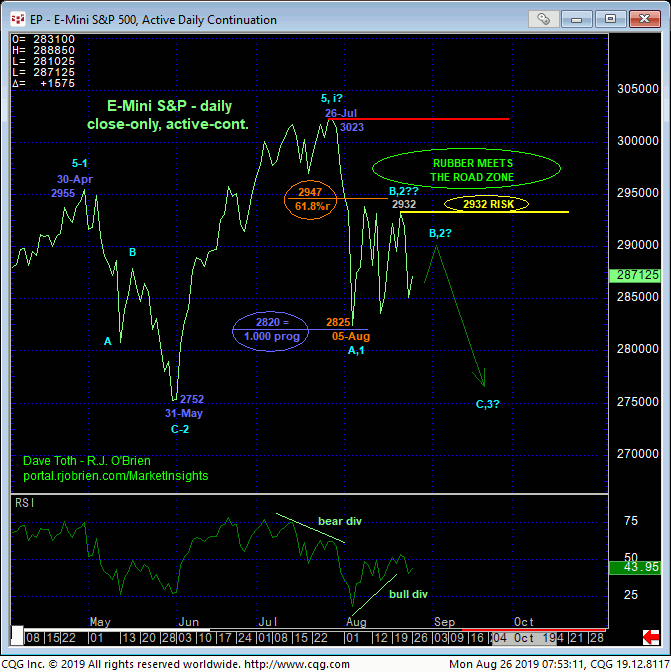
In both the daily bar chart above and close-only chart below, the recovery from early-Jun’s 2776 intra-day low and 2825 low close has been as labored and 3-wavish and corrective as it gets. Fri’s relapse did nothing but reinforce this bear market correction count and, most importantly, defined Thur’s 2940 high as THE high and key risk parameter this market now must recoup to mitigate a broader peak/correction/reversal count and resurrect a longer-term bullish one. A relapse below today’s 2810 low and short-term risk parameter will reinforce this count calling for a resumption of late-Jul/early-Jun’s initial (A- or 1st-Wave) decline to levels potentially far below 06-Aug’s 2776 low.

The fact that the sentiment/contrary opinion levels are already depressed to historically low levels is NOT consistent with a broader peak/correction/reversal scenario. In fact, such depressed figures have been outstanding contributing elements to the ENDS of correction within the secular bull market. Nonetheless, we’re not going to use sentiment/contrary opinion as an excuse or reason to ignore or fade a break below 2776 as, at that point, the longer-term trend would clearly be exposed as down. And once below such an initial counter-trend low like 2776, the market’s downside potential would have to be approached as indeterminable and potentially severe.
A recovery above 2940, on the other hand, would be an entirely different story and would once again give the bull the opportunity to perform.
These issues considered, the extent of Fri’s relapse contributes to a count that calls the recovery from early-Aug’s low a corrective event that warns of a resumption of late-Jul/early-Aug’s initial counter-trend break to 2776. Thur’s 2940 high serves as our new key risk parameter this market now needs to recoup to mitigate this bearish risk and resurrect a broader bullish count. Today’s 2810 low serves as a short-term risk parameter from which non-bearish decisions like short-covers or cautious bullish punts can be objectively based and managed. A relapse below 2810 will reinforce broader bearish and expose further and possibly protracted losses thereafter.


