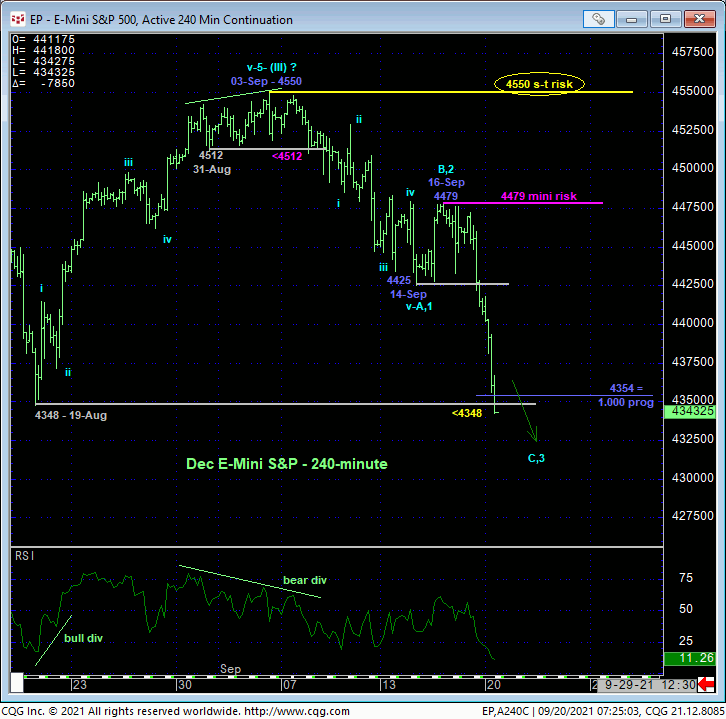
In 08-Sep’s Technical Blog following that day’s admittedly mini momentum failure below 31-Aug’s 4512 corrective low, we discussed exchanging larger-degree risk to 19-Aug’s next larger-degree corrective low at 4348 for whipsaw risk above 03-Sep’s rejected 4550 high given the fact that we’re in the month of Sep, when it’s not unusual to see the equity market struggle. Now, the 240-min chart below shows the market accelerating lower and breaking that 4348 next larger-degree corrective low, confirming a bearish divergence in DAILY momentum that poses a more significant threat against the bull.
As a direct result of Fri and today’s accelerating skid, the market has identified smaller-degree corrective highs at 4479 and certainly 4450 that its required to recover above to arrest this developing downtrend and re-expose the secular bull trend. Until it can recover above at least Thur’s 4479 high needed to suggest the decline from 4550 is a 3-wave and thus corrective structure, further and possibly accelerated losses now loom.

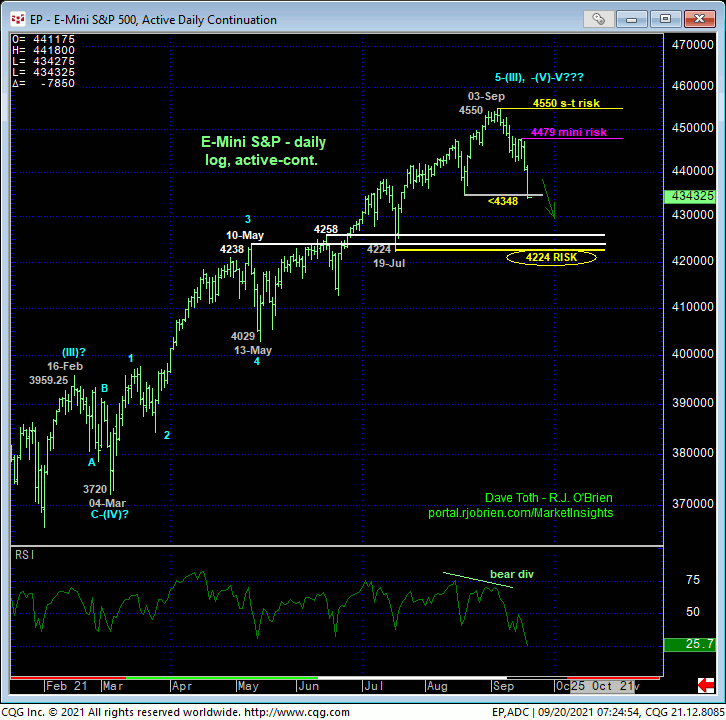
The daily log scale chart below shows the confirmed bearish divergence in daily momentum that breaks the uptrend from at least 19-Jul’s 4224 next larger-degree corrective low and key long-term risk parameter. We always discuss that we cannot conclude a broader peak/reversal count from proof of only smaller-degree weakness. Today’s sub-4348 weakness confirms a higher level of weakness and vulnerability than we’ve seen since mid-Aug and mid-Jul, but commensurately larger-degree weakness below 19-Jul’s 4224 larger-degree corrective low and area of former 4258-to-4238-area resistance-turned-support remains required to truly threaten the secular bull trend and expose a peak/reversal threat that could be major in scope.
IF this month’s slide is just another correction, then we would fully expect the market to arrest the clear and present intermediate-term downtrend with a bullish divergence in momentum somewhere between spot and 4224. A break below 4224 would be enough of a serious threat against the secular bull for even long-term institutional players and investors to move to the sidelines as the market’s downside potential below that threshold would be indeterminable and potentially severe.


Contributing to a broader peak /reversal threat are some frothy sentiment/contrary opinion levels like:
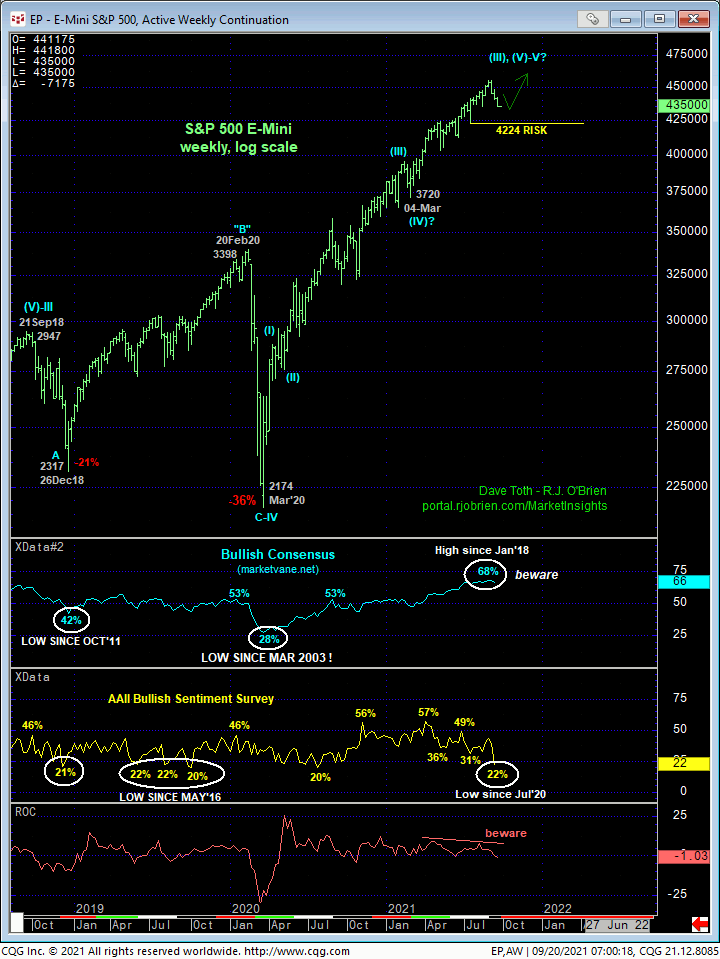
- the recent 68% reading in the Bullish Consensus (marketvane.net), its highest reading in nearly FOUR YEARS shown in the weekly log chart above and
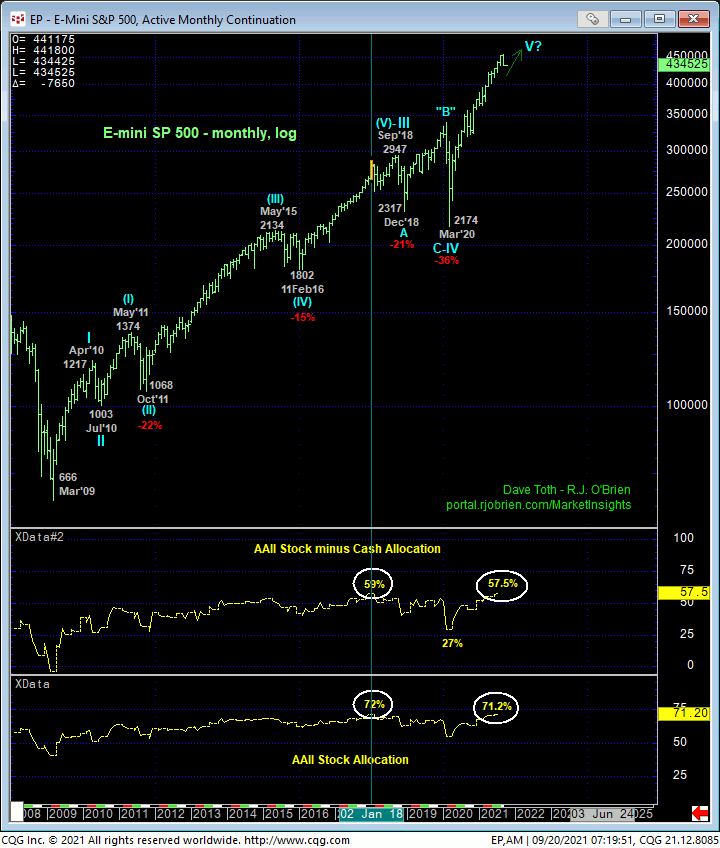
- historically high levels of stock allocation and stock-to-cash allocation ratio levels according to the American Association of Individual Investors (AAII) shown in the monthly log chart below.
COMBINED with today’s bearish divergence in momentum, the technical condition is clearly getting more threatening to bulls, with 19-Jul’s 4224 larger-degree corrective low the next absolutely pivotal threshold.
One element that doesn’t really add up however is the recent plunge to 22% in the AAII’s sentiment survey. This is the lowest since Jul’20 and indicates that the American investor to, in effect, getting out near the highs. This never happens as the huddled masses are typically way behind the curve. This fact would seem to support the bullish count that contends this month’s erosion is another correction and buying opportunity within the secular bull. If/when the market arrests this slide with a bullish divergence in momentum above 4224, the risk/reward bet from the bull side could be luscious. Until such a mo failure stems this slide, further losses remain anticipated.
These issues considered, all bullish policy and exposure have been nullified for shorter-term traders with a recovery above 4479 minimally required to flip the script back to the bull side. Longer-term player are advised to pare bullish exposure to more conservative levels and jettison remaining exposure altogether on a failure below 4224. We will keep a keen eye on momentum in the days immediately ahead and update accordingly if/when a confirmed bullish divergence arrests this slide and provides a favorable risk/reward play from the bull side.


