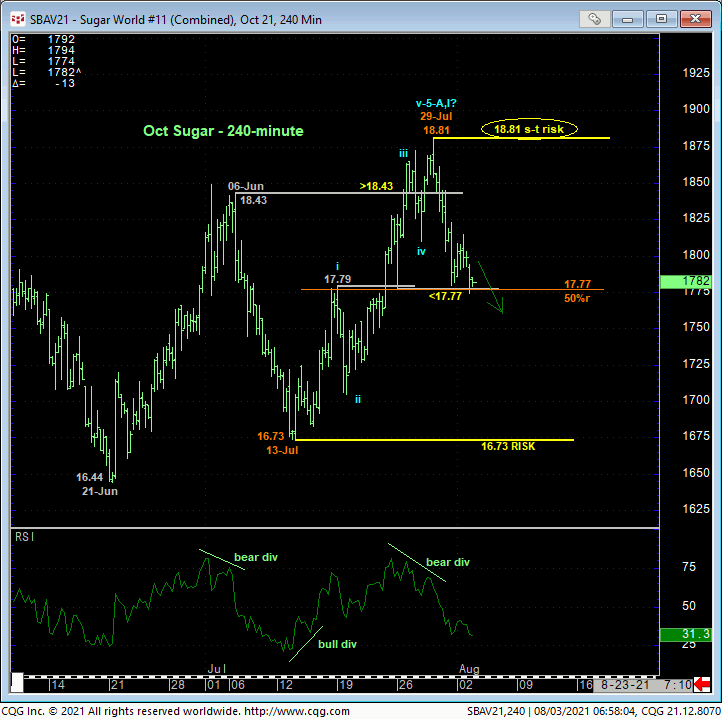
While overnight’s confirmed bearish divergence in momentum below 26-Jul’s 17.77 smaller-degree corrective low and short-term risk parameter discussed in 27-Jul’s Technical Blog is only of a short-term nature, the market’s failure to sustain gains above the past 2-1/2-MONTHS of resistance is hard to ignore as yet another factor that questions the risk/reward merits of a continued longer-term bullish count “up here”.
On an intra-day basis detailed in the 240-min chart below, today’s slip below that 17.77 corrective low defines 29-Jul’s 18.81 high as one of developing importance and the end of at least the rally from 13-Jul’s 16.73 larger-degree corrective low and key long-term bull risk parameter. Per such, last week’s 18.81 high serves as our new short-term risk parameter from which traders can objectively base non-bullish decisions like long-covers and cautious bearish punts as, obviously, this 18.81 level is THE level this market needs to recoup to mitigate a broader peak/correction/reversal threat and reinstate the secular bull.
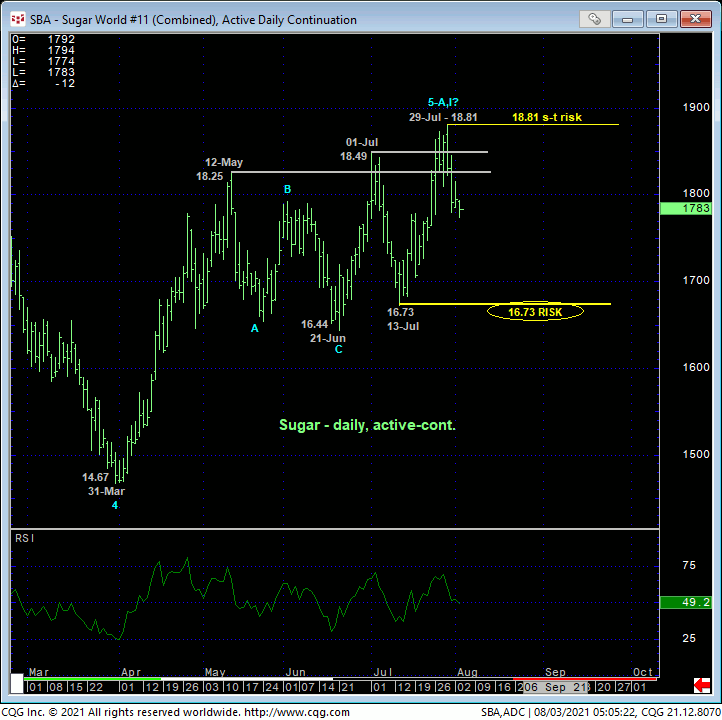
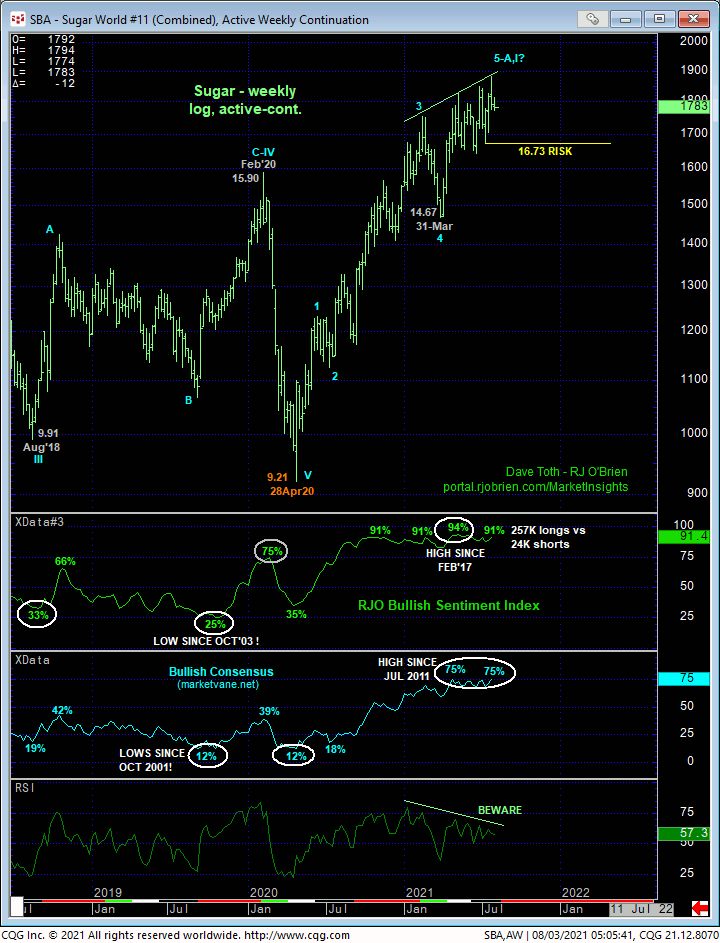
Stepping back a bit, the daily chart above shows early-Jul’s poke above the then-prior month-and-a-half’s resistance around the 18.00-to-18.25-area that it failed to hold ahead of a more protracted corrective relapse to 13-Jul’s 16.73 low. Now we see the bull’s failure to perform once again when it had every opportunity to do so at new highs for the massive 15-month uptrend and the highest prices in over four years.
The developing threat here is that this two-steps-up-one-step-down “rising-wedge” behavior shown in the weekly log chart below contributes to upside momentum that’s been waning pretty much all year. Combined with historically frothy sentiment/contrary opinion levels not seen in at least 4-1/2 years and, in the case of the Bullish Consensus (marketvane.net) since 2011, as well as an arguably complete or completing 5-wave Elliott sequence up from last year’s low, the elements typical of major peak/reversal environments are in place.
However and as we always discuss, we cannot conclude a larger-degree event from smaller-degree events. We cannot conclude a major top from proof of just smaller-degree weakness. Herein lies the importance of technical and trading SCALE where today’s short-term weakness is sufficient for shorter-term traders to step aside from bullish exposure while longer-term commercial players still have to acknowledge and accept commensurately larger-degree weakness below 13-Jul’s 16.73 larger-degree corrective low and key long-term risk parameter to neutralize a still-advised bullish policy. Indeed, it is crystal clear in these two longer-term charts that a failure below 16.73 is MINIMALLY required to even threaten, let alone break the secular bull trend.
In effect, the short-term trend is down within the longer-term trend that’s still arguably up. IF IF the past few days’ erosion is the start of a more protracted peak/correction/reversal process and in lieu of a failure below 13.73, then it is imperative that “more” non-upside behavior be provided in the form of continued impulsive behavior to the downside and proof of labored, 3-wave corrective behavior on recovery attempts. With the market currently in the middle of the range defined by our two key flexion points- 18.81 and 16.73- we will be watchful for a relapse-stemming bullish divergence in short-term mo that might re-expose the major bull and another bearish divergence in mo following a likely recovery attempt that falls shy of 18.81 for a favorable risk/reward opportunity from the bear side. Flexibility to either directional outcome and patience will come in handy in the week or two ahead.