SEP 10-Yr T-NOTES
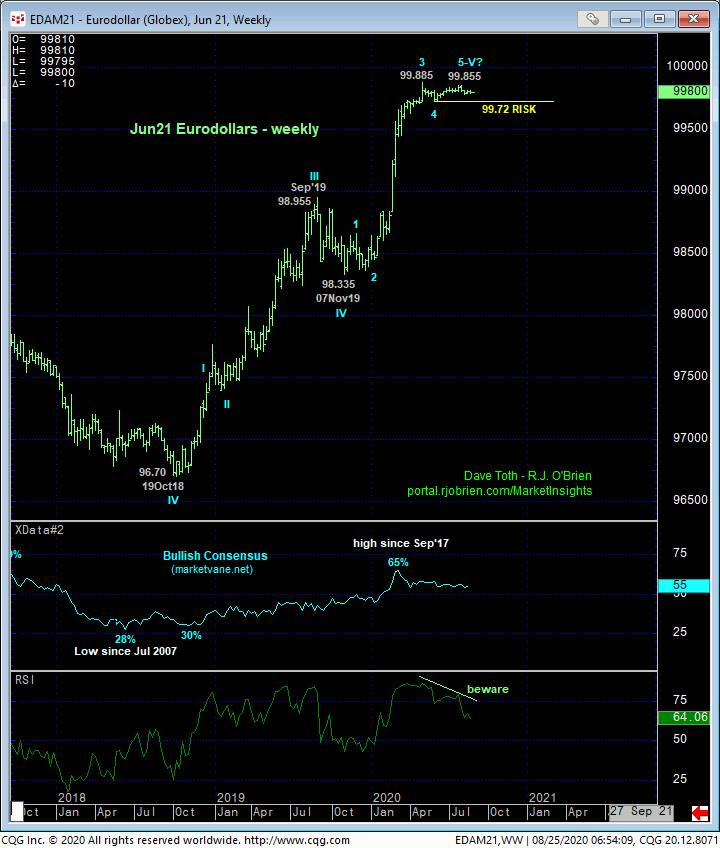
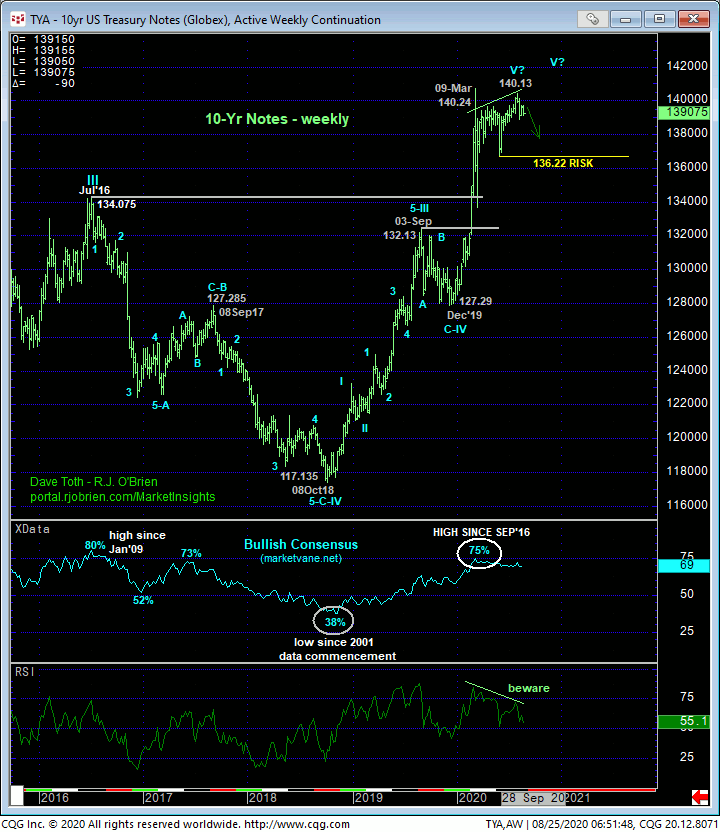
In 11-Aug’s Technical Webcast we introduced the prospect of a peak/reversal threat that could be major in scope. Inappropriately premature after proof of admittedly just short-term weakness, we also discussed the likelihood of a requisite (B- or 2nd-Wave) corrective rebuttal to early-Aug’s 140.13 – 138.285 trendy, impulsive, 5-wave-looking decline typical within a peak/reversal process. With overnight’s confirmed bearish divergence in short-term momentum below 19-Aug’s 139.085 minor corrective low detailed in the 240-min chart below, the market has identified Fri’s 139.235 high as the END of what looks to be a 3-wave recovery from 13-Aug’s 138.285 low. Left unaltered by a recovery above 139.2435, this 3-wave recovery may be considered the (B- or 2nd-Wave) recovery within the peak/reversal threat process that now warns of a resumption of early-Aug’s downtrend that preceded it to new lows below 138.285. Per such, we’re identifying 139.24 as our new short-term risk parameter from which the risk of a new bearish policy can be objectively based and managed.
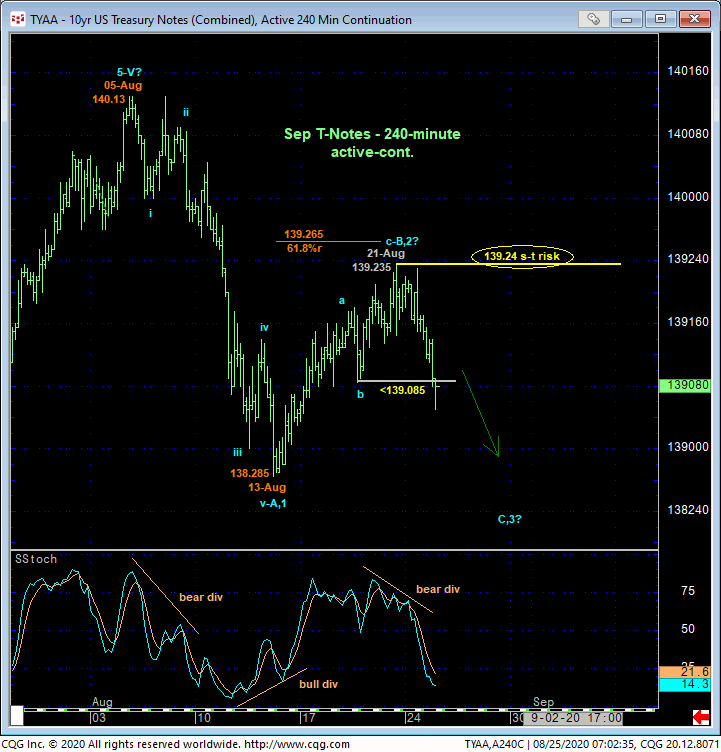
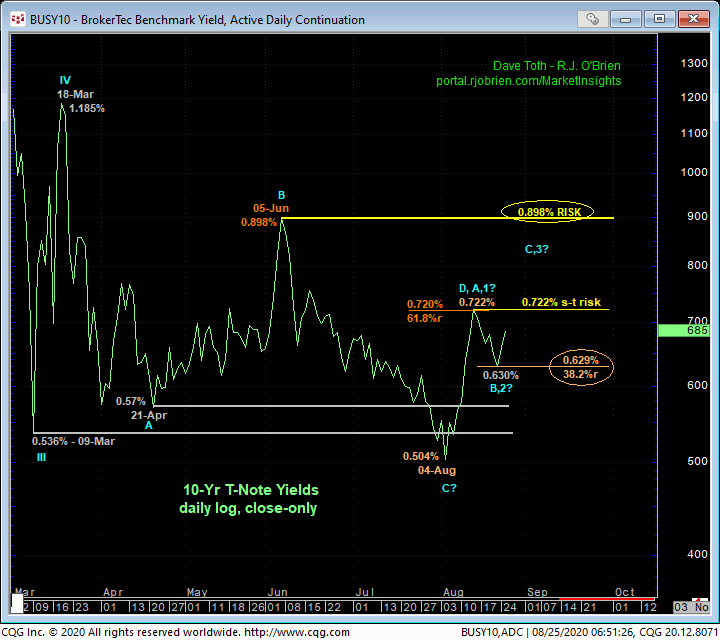
Reinforcing the prospect that Fri’s 139.235 high in the contract might have completed a B- or 2nd-Wave correction of early-Aug’s A- or 1st-Wave decline is the Fibonacci fact that Fri’s 0.630% close on a daily yield basis above is the exact 38.2% retrace of early-Aug’s 0.504% – 0.722% increase in 10-yr rates shown in the daily close-only chart above. Granted, a rate recovery above 13-Aug’s 0.722% high is required to CONFIRM this count, but today’s mo failure in the contract is more than sufficient to define 139.24 as a short-term risk parameter from which a bearish policy and exposure can be objectively based and managed.
Traders are reminded that this peak/reversal-threat count is predicated on:
- 11-Aug’s confirmed bearish divergence in daily momentum below 28-Jul’s 139.08 corrective low
- the market’s failure to sustain late-Jul/early-Aug’s “breakout” above the prior THREE MONTHS’ resistance from the 139-3/4-area
- the market’s gross failure to sustain late-Jul/early-Aug’s below the past FIVE MONTHS’ lows in rates around 0.57%-to-0.54%
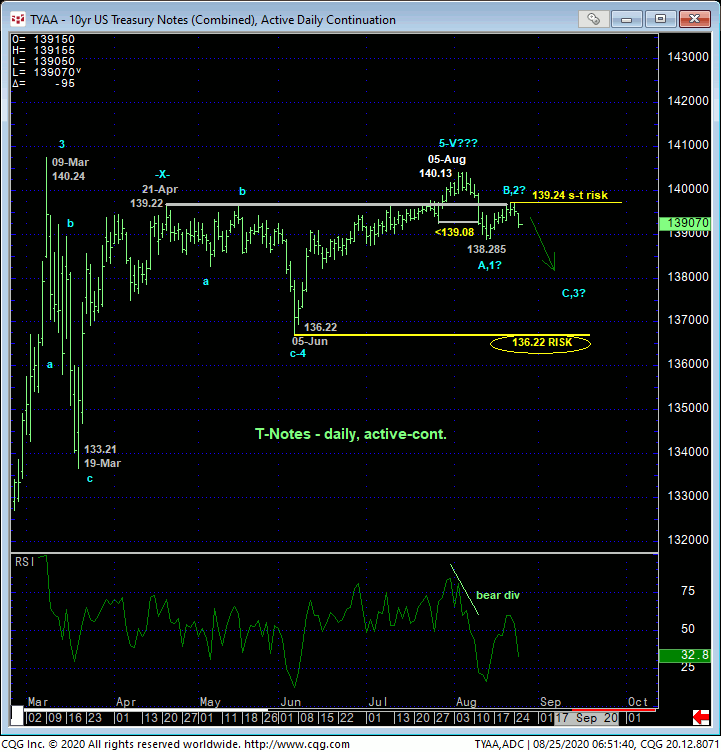
- historically frothy sentiment/contrary opinion levels not seen since those that warned of and accompanied Jul’16’s 134-1/4 major high/peak/reversal
- waning momentum on a WEEKLY scale shown below and
- an arguably complete 5-wave Elliott sequence that dates from Oct’18’s 117.13 low as labeled below.
As always, we cannot conclude a larger-degree event from proof of just smaller-degree weakness that the market has shown thus far, but the facts and observations listed above are incriminating. And while commensurately larger-degree weakness below 05-Jun’s 136.22 larger-degree corrective low (and 05-Jun’s 0.898% larger-degree corrective high in rates) remains required to confirm a bearish divergence in momentum necessary to, in fact, break the secular bull trend, the market has been accommodating in identifying specific highs at 139.24 and certainly 140.13 from which non-bullish decisions like long-covers and new bearish punts can now be objectively based and managed. And if correct, the risk/reward merits and opportunity of a bearish policy from current 139.06-area level would be insane.
These issues considered, traders are advised to move to a bearish policy and exposure from at-the-market (139.06 OB) with a recovery above 139.24 required to defer or threaten this call enough to warrant its cover. In lieu of such 139.24+ strength, we anticipated further lateral-to-lower prices in the period ahead that would be expected to accelerate in a more obvious, impulsive manner down the road.
SEP GERMAN BUNDS
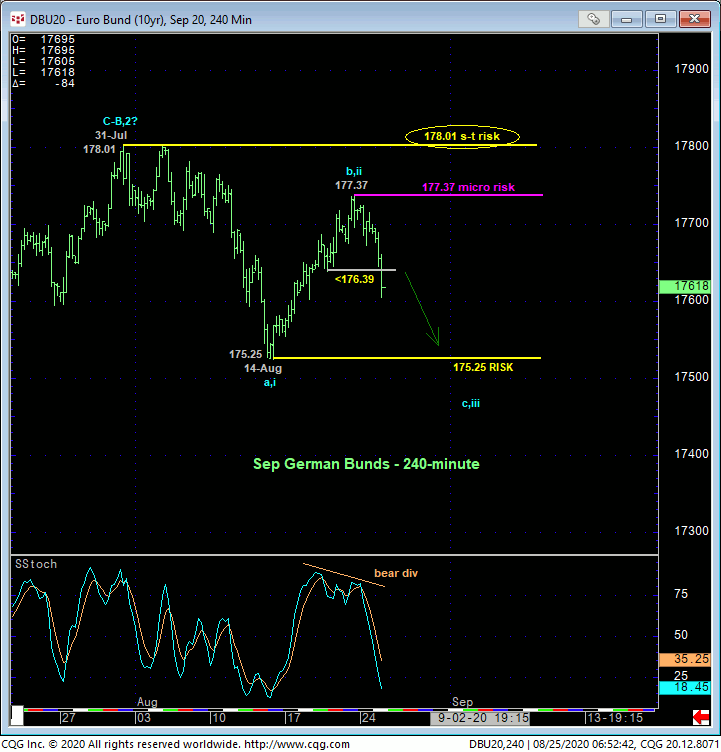
Against the backdrop of our analysis of overnight’s momentum failure in T-notes
and the relative positive correlation between T-notes and German bunds, it’s
not a surprise that Sep Bunds also confirmed a bearish divergence in short-term
momentum below 19-Aug’s 176.39 corrective low detailed in the 240-min chart
above. This mo failure defines Fri’s 177.37 high as the
end of mid-Aug’s recovery attempt and a micro risk parameter from which
non-bullish decisions like long-covers and cautious bearish punts can now be
objectively based and managed.
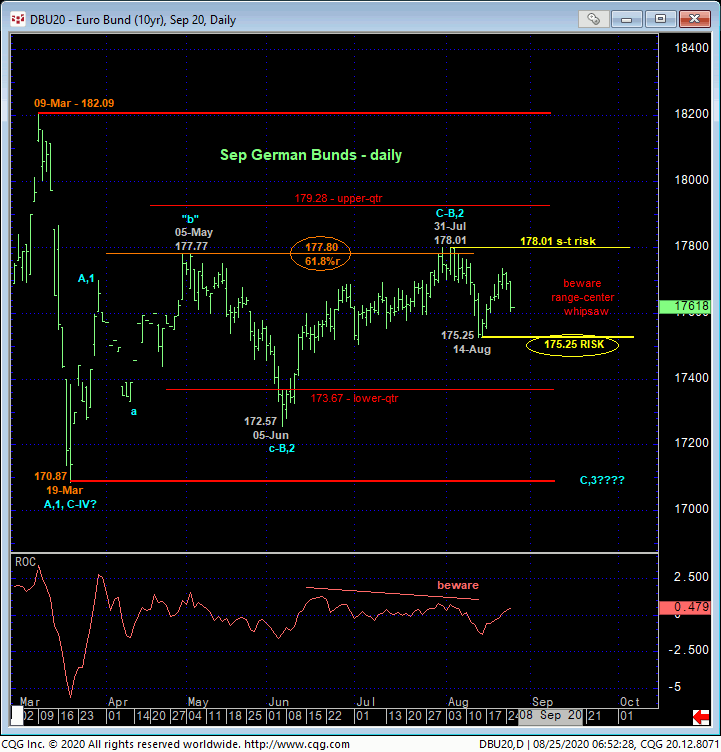
The challenge with the bund market is that the Sep contract remains deep, deep within the middle-half bowels of this year’s 182.09 – 170.87-range shown in the daily chart below where the odds of aimless whipsaw risk are approached as higher. This warrants a more conservative approach to risk assumption that highlights the identification of tighter but objective risk parameters like 177.37, 31-Jul’s 178.01 high and 14-Aug’s 175.25 low.
If there’s a positive to be gleaned from enduring a bloody lateral choppy mess like this market has exhibited for the past five months is that the boundaries and prospective breakout flexion points are very well marked. A recovery above 178.01 will mitigate our broader peak/reversal count while a break below 175.25 will reinforce it. We also have the ancillary factor that bunds ain’t likely to move in the opposite direction of U.S. Treasuries, so we can use our T-Note analysis as a proxy for assessing bunds. And currently this warns of directional scales tilting lower.
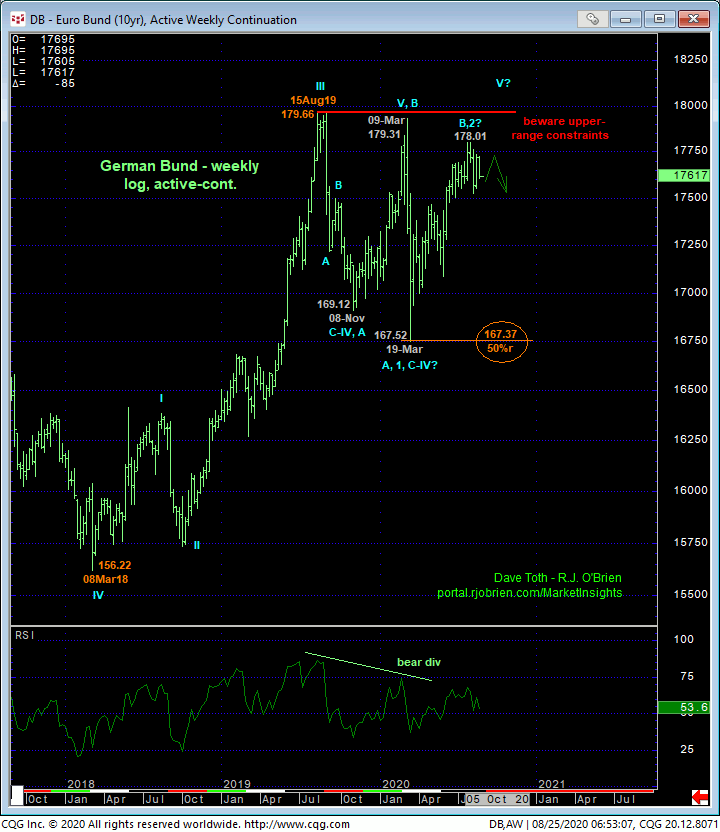
Finally, the weekly log chart of bunds below shows the market’s perilous proximity t the upper recesses of the range that has encapsulated it for the past YEAR amidst waning upside momentum. Minimally, these facts question the risk/reward merits of a bullish policy “up here”. At best and while 31-Jul’s 178.01 high remains intact as a short-term risk parameter, the risk/reward merits of a bearish policy and exposure could be extraordinary.
These issues considered, trader are advised to move to a cautious bearish policy and exposure from 176.63 OB with a recovery above 177.37 required to negate this specific call and warrant its cover. In lieu of at least such 177.37+ strength, we anticipate lateral-to-lower prices ahead with a break of 14-Aug’s 175.25 low reinforcing this bearish count and exposing potentially sharp, sustained, impulsive losses thereafter.
JUN21 EURODOLLARS
Here too, in 11-Aug’s Technical Blog we introduced the prospect for a peak/reversal count that could be major in scope, allowing for an eventual (B- or 2nd-Wave) corrective rebuttal to late-Jul/early-Aug’s initial counter-trend decline. The daily close-only chart below shows that following 10-Aug’s bearish divergence in momentum, the market has thus far retraced exactly 61.8% of the initial 99.845 – 99.785 decline that cannot be ignored as the B- or 2nd-Wave correction typical of peak/reversal processes.
30-Jul’s 99.845 high remains intact as our key short-term risk parameter the market needs to recoup to negate this peak/reversal process. A relapse below 11-Aug’s 99.785 initial counter-trend low will reinforce it. Nonetheless, 08-Jun’s 99.74 next larger-degree corrective low remains intact as our key long-term risk parameter the market needs to break to confirm a bearish divergence in momentum of a scale sufficient to threaten the secular bull trend.
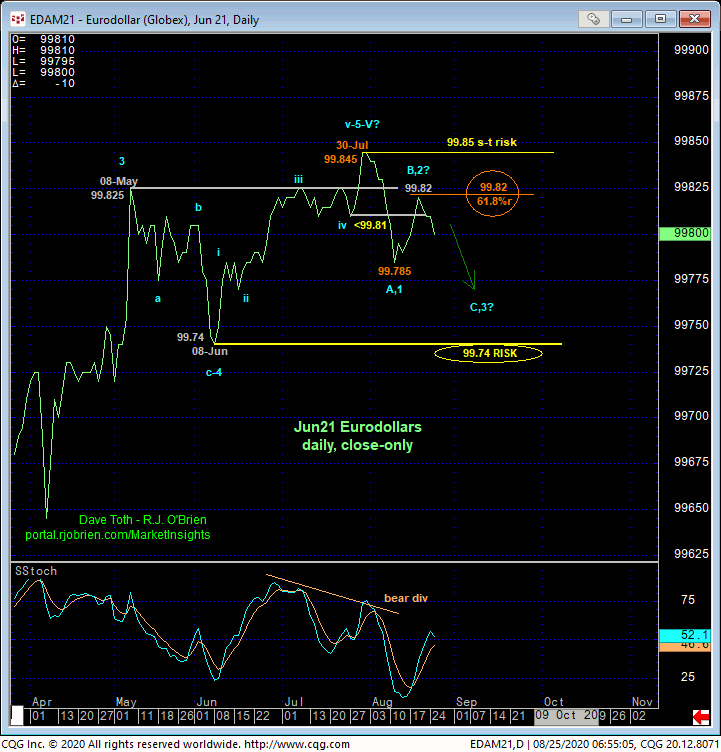
This said:
- 10-Aug’s bearish divergence in daily momentum
- a textbook complete 5-wave Elliott sequence from 08-Jun’s 99.74 low to 30-Jul’s 99.845 high
- waning upside momentum on a WEEKLY basis below
- historically frothy sentiment levels this year not seen since those that warned of and accompanied Jul’16’s major peak/reversal and
- an arguably complete and major 5-wave Elliott sequence from Oct’18’s 96.70 low to Jul’20’s 99.855 high
provide an incriminating amount of evidence that warns of a peak/reversal environment that would/could be nothing short of major in scope.
These issues considered, traders are advised to move to a cautious bearish policy and exposure from 99.80 OB with a close above 99.82 negating this specific call and warranting its cover. In lieu of such strength, further and possibly sustained losses are expected in the period ahead.
