Given the extraordinary heights many markets and market sectors have achieved and especially the explosive manner in which they’ve achieved them, we’re devoting this technical blog to detailing HOW markets typically top out and our three key reversal requirements and technical discipline to most effectively and objectively navigate the correction-vs-reversal debates and challenges typical of all topping processes. We will be using the energy complex- crude oil, heating oil and RBOB- in this analysis, but the discipline and technical elements detailed below apply to the major rallies across the entire ag sector, metals, livestock and softs.
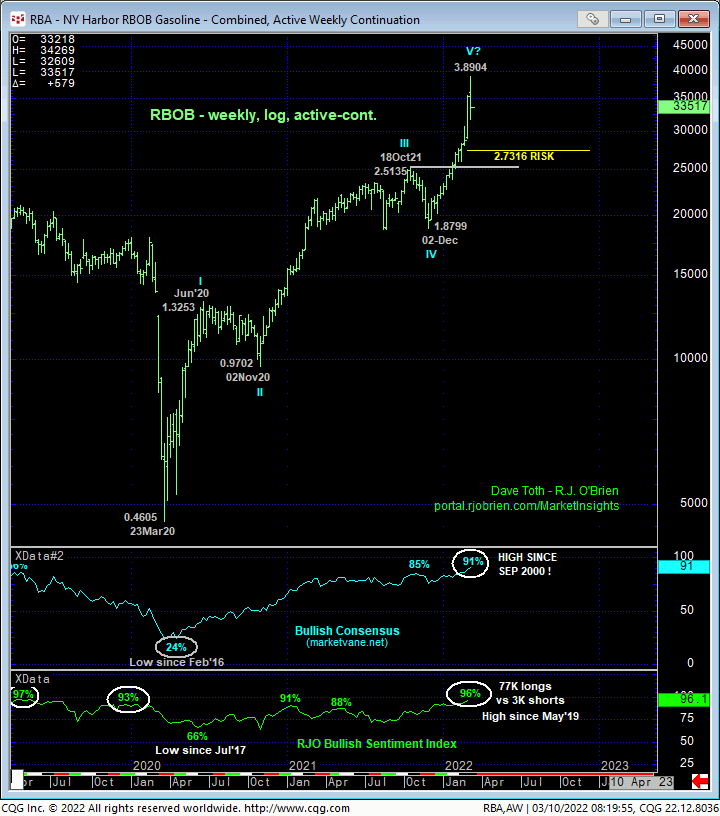
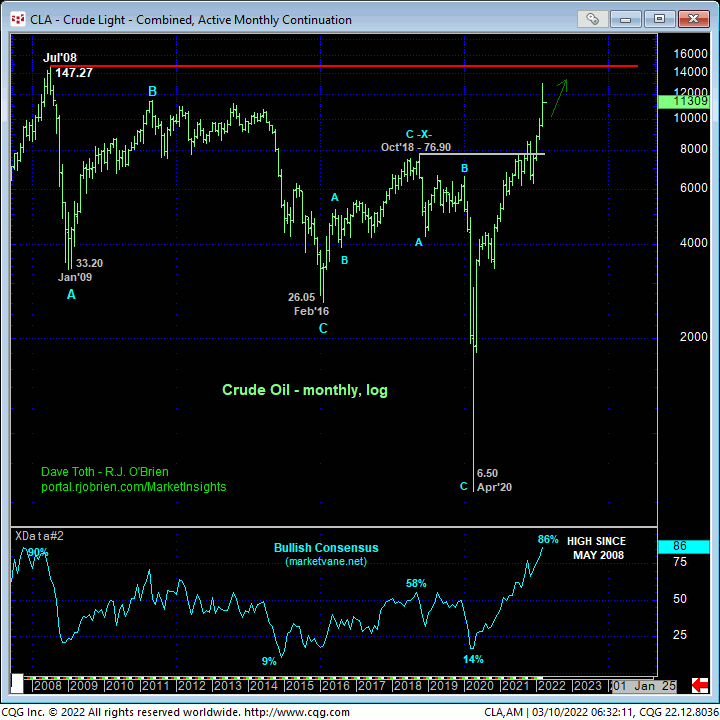
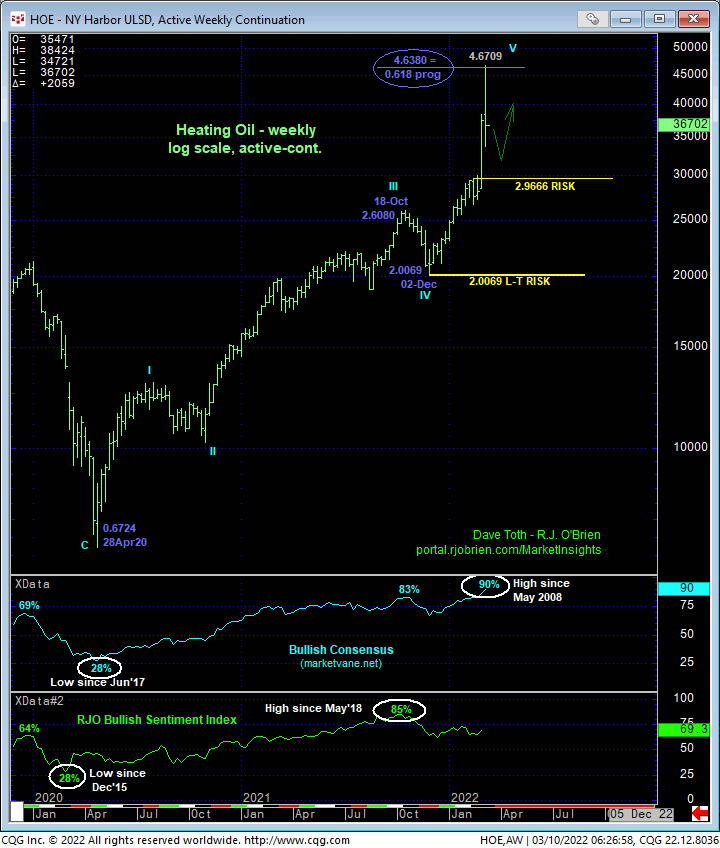
Before getting into energy complex specifics, there are a couple issues and considerations that apply across the board that we want to summarize here in the interests of brevity below. First, it goes without saying that such extraordinary bull trends generate understandably historically frothy sentiment/contrary opinion levels. Such extremely bullish skews warn of and accompany virtually all major peak/reversal processes as the huddled masses, including professional traders and investors, are always most bullish and long at market peaks. However, sentiment can maintain frothy levels indefinitely and are not applicable technical tools in the absence of an accompanying confirmed bearish divergence in momentum of a scale sufficient to even threaten, let alone break the major bull trend. Herein lies the importance of the first of our three key reversal requirements: a bearish divergence in MOMENTUM.
Secondly, and especially up at current historically high prices where extreme, wild nominal moves are relative drops in a bucket on a percentage basis, one has to ask and consider whether a perceived extreme intra-day or intra-week setback breaks the simple but major uptrend. This week, we’ve seen monster setbacks across many of the bull trends in question, but relative to the magnitude of their secular bull trends, these setbacks are thus far of insufficient scales to conclude anything more than interim corrections within still-unfolding secular bull trends. Against a backdrop of stratospheric sentiment levels and acting on the premise that we don’t know whether recent highs have completed 5-wave Elliott sequences as part of major peak/reversal processes, we rely on our three key reversal requirements for most effective navigation of the correction-vs-reversal challenges typical of virtually all peak/reversal-threat environments.
In approaching and assessing any of the major bull markets currently, we urge traders to consider our three key reversal requirements we have found that aid tremendously in navigating a market top:
- a confirmed bearish divergence in momentum of a scale
sufficient to threaten or break the major bull trend; a divergence
is confirmed in one of two way:
- a failure below a prior corrective low or
- a failure below an initial counter-trend low
- proof of trendy, impulsive 5-wave behavior on the initial counter-trend decline, and, most importantly,
- proof of 3-wave corrective behavior on a subsequent recovery attempt.
This third requirement is the most useful, although it requires some patience as often times and perhaps like this week, it’s debatable whether 1) the market has completed a major wave sequence to the upside and 2) if the relapse is the start of the reversal or just another correction within the major bull trend. IF the decline is the start of the reversal, then by definition 1) the against-the-new-current recovery must be a 3-wave corrective structure that 2) cannot take out whatever high is left in the wake of the preceding decline.
Keeping these three key reversal requirements in mind, as well as the sentiment and major trend considerations mentioned above, will help in navigating the correction-vs-reversal debates currently unfolding in the energy sector we’ll detail below as well as in other major bull trend markets like the ags.
APR CRUDE OIL
Yesterday’s failure below our next larger-degree corrective low and short-term risk parameter at 106.43 from 03-Mar confirms a bearish divergence in momentum. This mo failure allows us to conclude Mon’s 130.50 high as the end of the rally from 18-Feb’s 87.46 low and our new SHORT-TERM risk parameter from which non-bullish decisions like long-covers and bearish punts can be objectively based and managed.
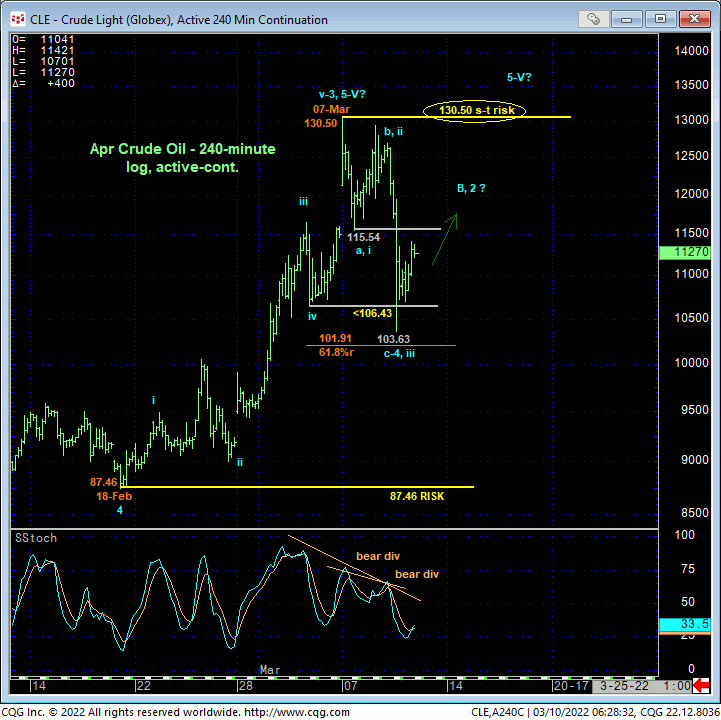
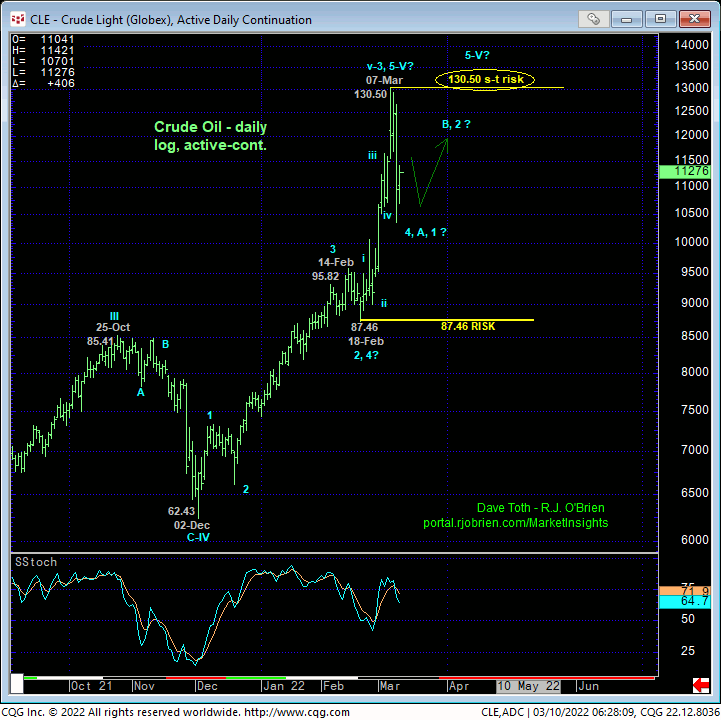
Given the magnitude and still-arguably-accelerating nature of late-Feb/early-Mar’s rally however, the extent of the past couple days’ setback is far from a sufficient SCALE to conclude the end of the secular bull trend. Could the rally from 02-Dec’s 62.43 low to Mon’s 130.50 high be a complete 5-wave Elliott sequence as labeled in the daily log chart above? Absolutely. But that 130.50 high might have also just completed the 3rd-Wave of an eventual 5-wave sequence up that would contend this week’s violent setback is “just” a 4th-Wave correction. So how do we judge from here?
Defer to our three reversal requirements. Has the first requirement of a momentum failure on scale sufficient to threaten the major bull trend been satisfied? No, or at least not yet. Has this week’s sell-off unfolded in a trendy, impulsive 5-wave manner? No, not yet. But even one debates these two answers or if we want to consider the answers as yes, the key third requirement of proof of 3-wave corrective behavior on a subsequent recovery attempt has yet to be satisfied.
As discussed often, the forces behind major moves such as in crude oil are not going to just evaporate overnight. They’ve been developing for TWO YEARS and will likely take TIME and considerable and potentially violent, volatile topping price action before being overtaken by new longer-term bearish forces. Herein lies the crucial importance of the third of our key reversal requirements. On the heels of this week’s setback, IF the market labors in a 3-wave corrective retest of Mon’s 130.50 high over the next week or so that is stemmed by a bearish divergence in short-term mo from some level shy of 130.50 AND THEN breaks yesterday’s 103.63 initial counter-trend low, then more evidence will be in place for a larger-degree correction or possibly a major reversal lower. Until such behavior and requirements are met and given the backdrop of one of this markets most extraordinary bull moves, a resumption of the secular bull market to new highs above 130.50 should hardly come as a surprise. And for those who believe, for whatever reason, that the market has topped, 130.50 is THE risk parameter that negates this bet and reinstates the major bull.
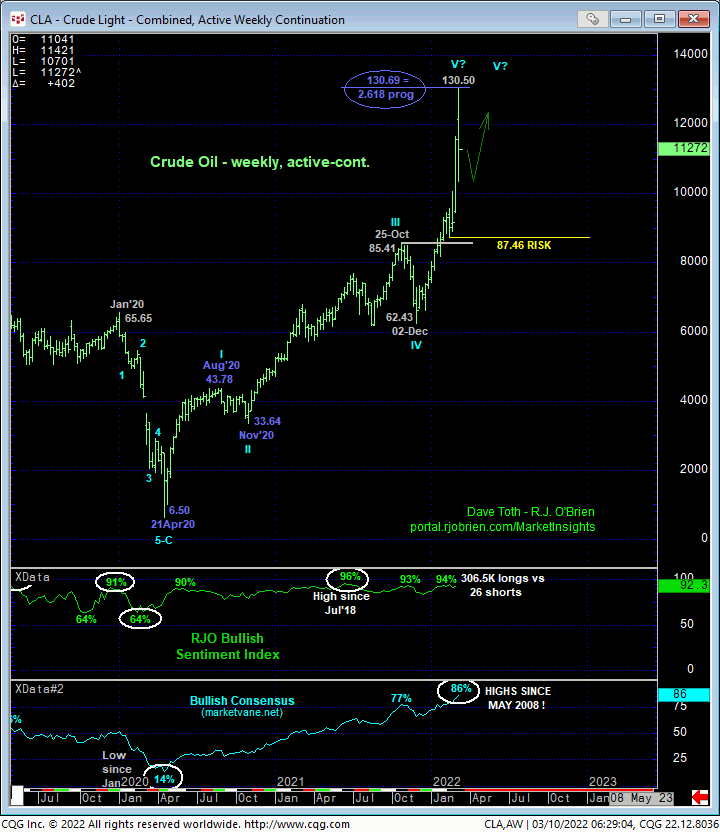
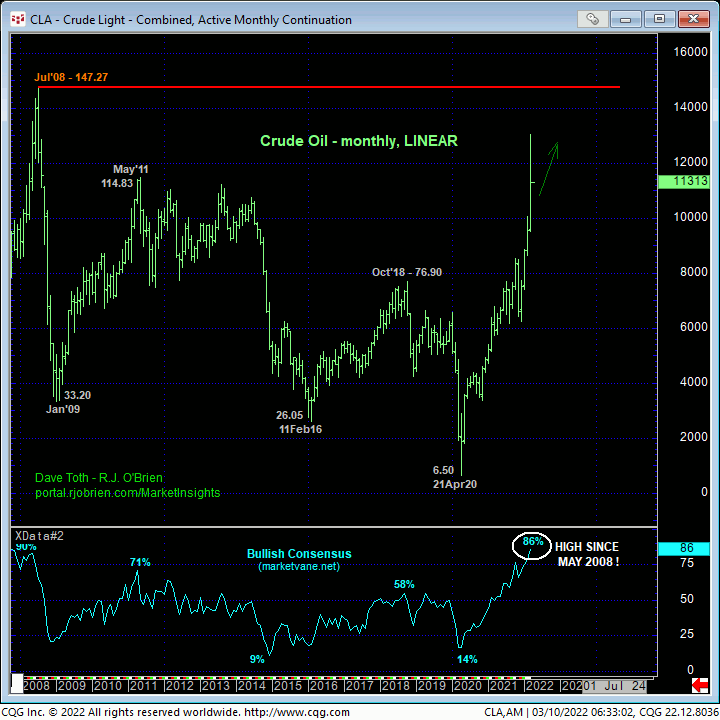
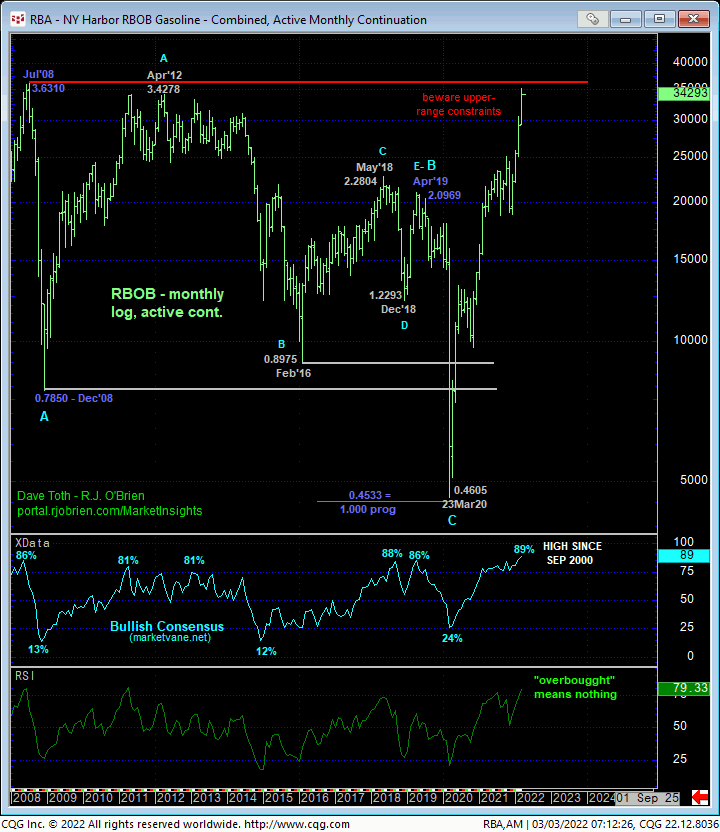
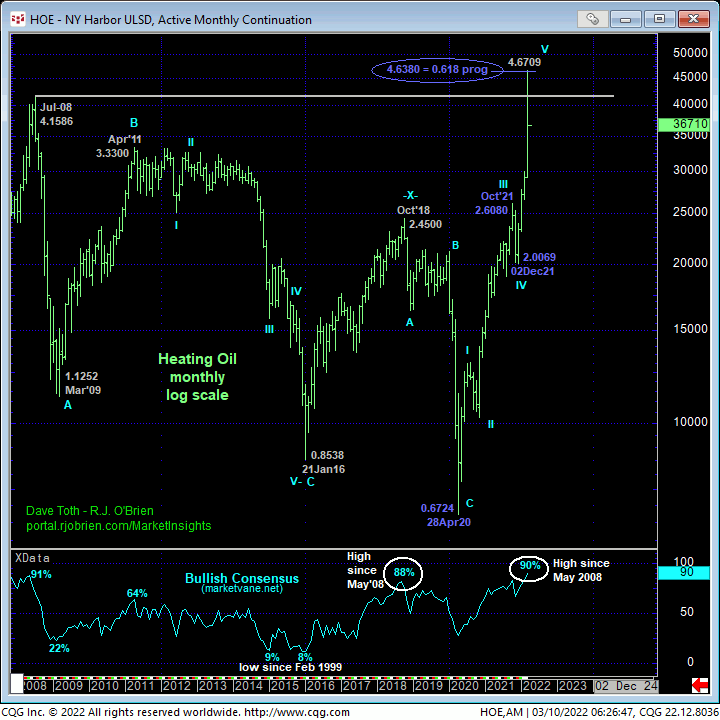
Finally and on a long-term basis, the monthly charts above and below show the difference between a linear, arithmetic scale and a logarithmic scale. While recent intra-day and intra-week swings have been nominal whoppers, on a percentage basis they’re relatively in order. That’s just what ya get when a market’s 2-or-3-times the price it was a year ago. The same with corn, beans, wheat, etc. In identifying risk levels, even smaller-degree corrective lows and highs are nominally distant. The technical construct and pertinence of these levels involves the same technical discipline, only the relative levels are nominally farther away.
Another facet of this nominal-vs-logarithmic difference is that while the market remains seemingly distant from 2008’s 147.27 high or even Mon’s 130.50 high, on a percentage basis achieving those heights is easily fathomed.
These issues considered, despite a $27 setback from Mon’s 130.50 high, we believe the market has yet to produce the evidence to suggest that this setback is anything but a correction within the ongoing secular bull trend to eventual new highs above 130.50. We will, of course, be watchful for signs of labored, corrective behavior on recovery attempts that may start to tilt longer-term directional scales away from the bull and in favor of the inevitable bear. But until this evidence unfolds, traders are advised to anticipate higher prices ahead. The challenge then is where and when to re-establish bullish exposure. With shorter-term whipsaw risk clearly an issue, we will be watchful in the days ahead for evidence that yesterday’s 103.63 low might have defined the end or lower boundary of a (4th-Wave) correction ahead of a resumption of the secular bull and an objective risk parameter from which to rebase and manage a resumed bullish policy. For the time being a neutral/sideline policy is advised.
APR HEATING OIL
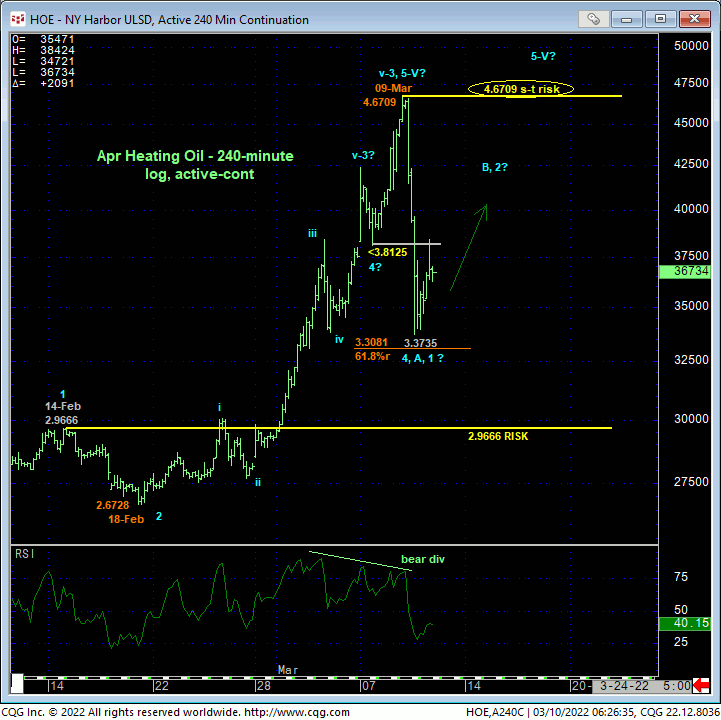
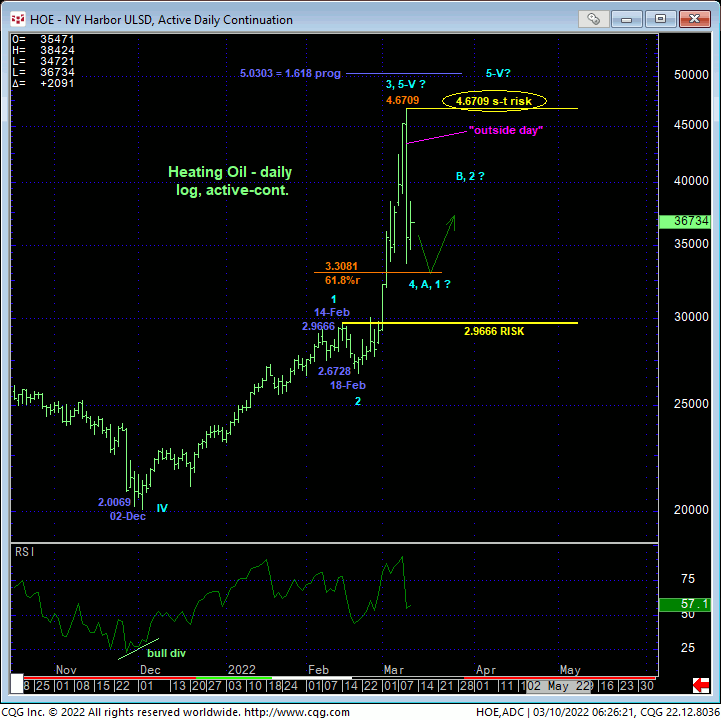
The technical construct and expectations for diesel are identical to those detailed above in crude, with this week’s momentum failure below 3.8125 defining yesterday’s 4.6709 high as the end of at least the rally from 18-Feb’s 2.6728 low. Per such, yesterday’s 4.6709 high is considered our new short-term but key risk parameter from which non-bullish decisions like long-covers can be objectively based and managed. Given the magnitude of the secular bull trend however, it would be premature to conclude yesterday’s 4.6709 high as THE END to the secular bull market based on a bearish divergence in only short-term momentum. IF this week’s relapse IS the initial 1st-Wave of a major reversal, minimally, we would anticipate and require proof of 3-wave corrective behavior back up that could be extensive but subsequently stemmed by another bearish divergence in momentum shy of 4.6709 before leaning towards a new bearish policy.
As the market has yet to provide evidence to suggest that this week’s setback is over ahead of either a steeper corrective rebound or a resumption of the secular bull trend, a neutral/sideline policy is advised for the time being. But traders should not be surprised at all by a return to at least 4.000+ levels in the week or two ahead.
APR RBOB
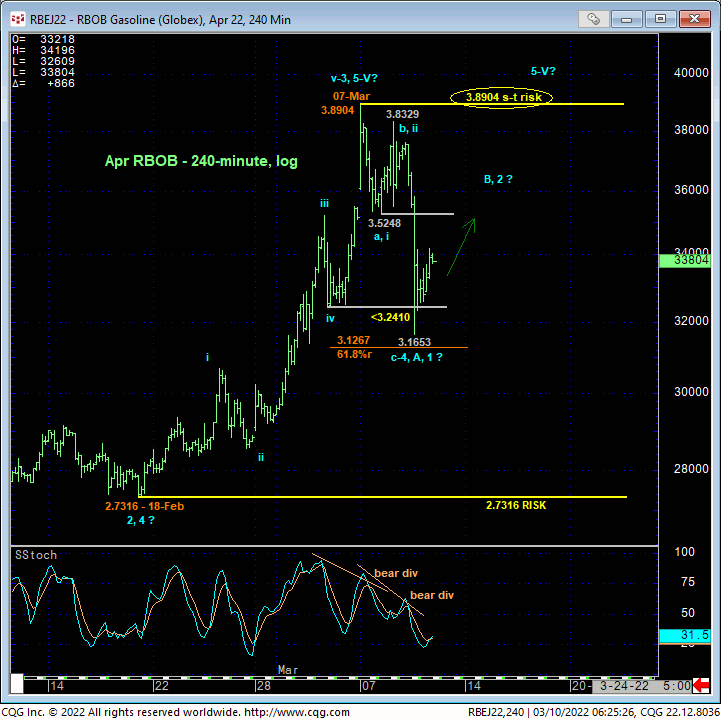
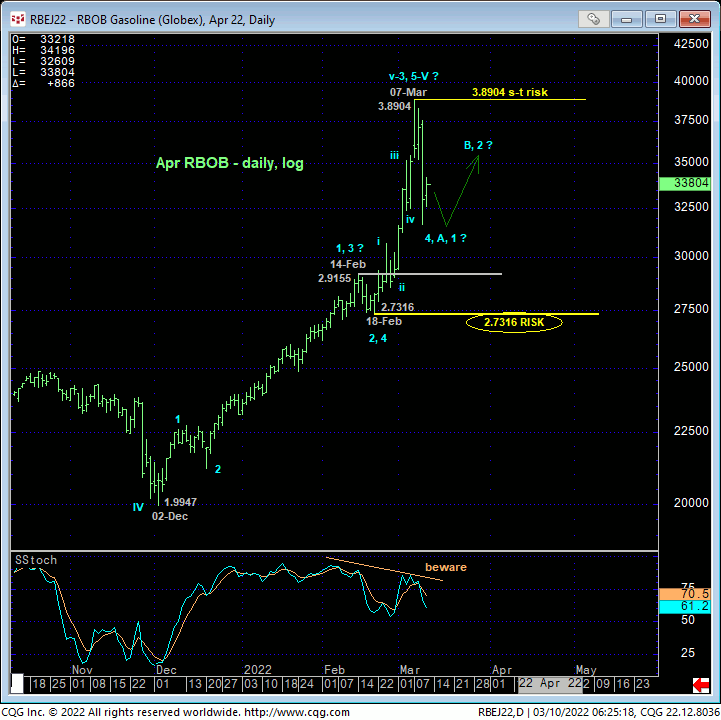
Here too, the technical construct and expectations for RBOB is the same as those detailed above. This week’s setback has obviously defined Mon’s 3.8904 high as one of developing importance, but for reasons cited above, this setback is thus far of an insufficient scale or evidence to suggest the secular bull market ended Mon at 3.8904. We believe odds favor this week’s setback as another correction within the secular bull trend ahead of eventual new highs above 3.8904. IF this count is wrong however and IF this week’s break is the initial wave of a major peak/reversal environment, proof of 3-wave, corrective behavior on a recovery attempt is likely. And this recovery could be extensive in terms of price and/or time. As the market has yet to provide the evidence that this week’s setback has ended however, a neutral/sideline policy is advised for the time being. Once such a low and support is appropriately identified with a countering bullish divergence in short-term mo that can then be used as an objective risk parameter, a favorable risk/reward opportunity will be presented from the bull side for at least a steeper corrective rebound or possibly the resumption of the secular bull
