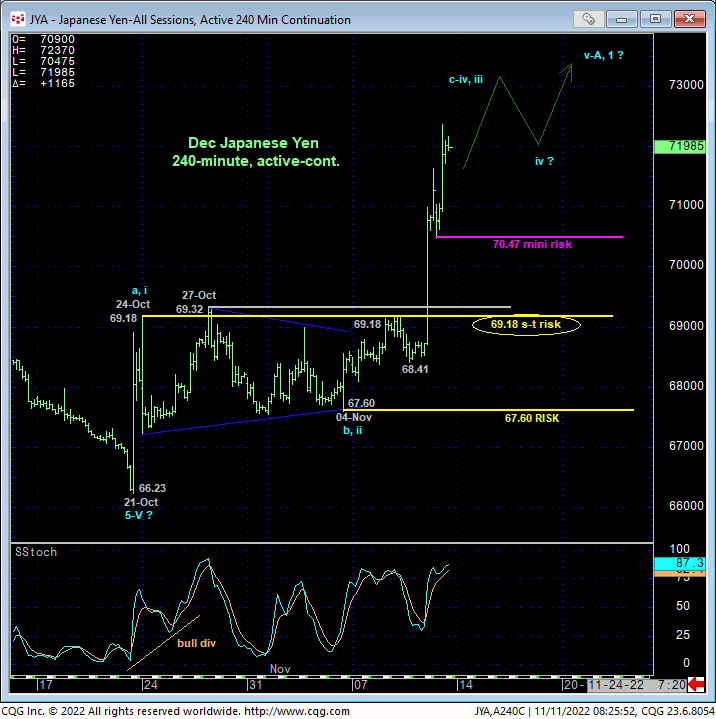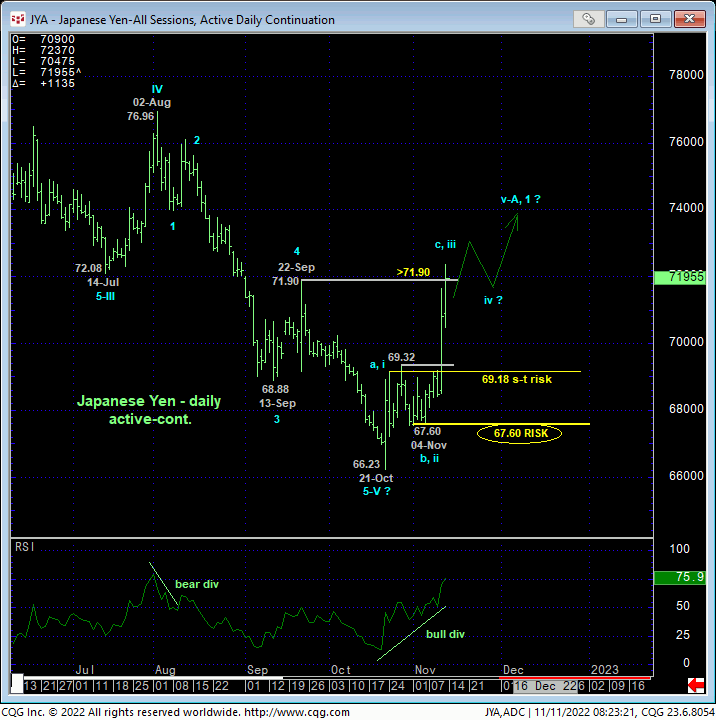
In yesterday’s Technical Webcast we discussed yesterday’s impressive, impulsive bust-out above the past 2-1/2-weeks’ resistance around the lower-69-handle as clearly confirming some semblance of strength, but not of a scale sufficient to threaten the secular bear trend. However, today’s continuation of this rally above 22-Sep’s 71.90 larger-degree corrective high and our key long-term bear risk parameter confirms a bullish divergence in WEEKLY momentum that IS of a sufficient scale to break at least Aug-Oct’s portion of the secular bear trend. Amidst with historically bearish sentiment/contrary opinion levels and a complete 5-wave Elliott sequence down from at least 02-Aug’s 76.96 high and possibly a massive sequence from Jan’21’s 97.55 high, the market has arguably posed the technical trifecta of major base/reversal environments.
Starting off from a short-term, 240-minute basis, the chart below shows this week’s decisive breakout above the lower-69-handle-area resistance that is now considered new near-term support. We’re defining 24-Oct’s 69.18 high as our new short-term bull risk parameter because that high is either the 1st-Wave of an eventual 5-wave sequence up that would be what is expected of the initial counter-trend move up of a new bull market or the a-Wave of another bear market correction. The market’s failure to sustain trendy, impulsive gains above 69.18 will jeopardize the impulsive integrity of a bullish count, expose the recovery from 21-Oct’s 66.23 low as a prospective 3-wave and thus corrective affair and re-expose the secular bear trend. Subsequent and commensurately larger-degree weakness below 04-Nov’s suspected 2nd-Wave corrective low at 67.60 will surely nullify the impulsiveness of the developing rally and re-expose the long-term bear trend. Per such, this 67.60 level is considered our new long-term bull risk parameter pertinent to longer-term institutional players.


From a longer-term perspective, this week’s rally is the best performance by the yen since 2020. The extent of this week’s rally on a daily basis above certainly has “3rd-wave” characteristics (of an eventual 5-wave sequence up from 21-Oct’s 66.23 low). But the extent of this recovery above 22-Sep’s 71.90 larger-degree corrective high is clearly enough to identify 21-Oct’s 66.23 low as THE END of a 5-wave Elliott sequence down from 02-Aug’s 76.96 high.
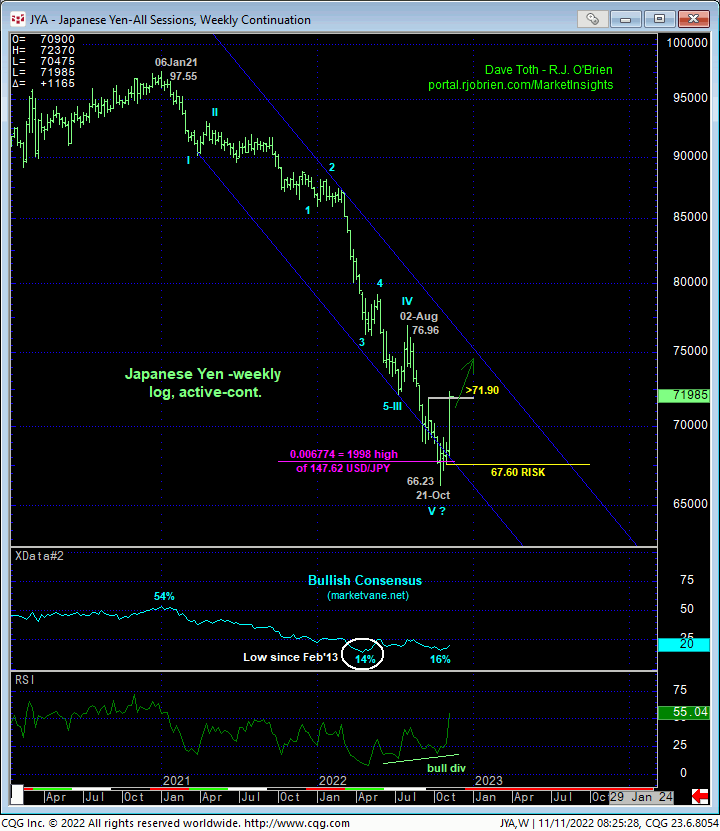
More importantly, on an even longer-term basis, the weekly log chart below shows the technical trifecta of:
- a confirmed bullish divergence in WEEKLY momentum amidst
- historically bearish levels in the Bullish Consensus (marketvane.net) measure of market sentiment/contrary opinion, and
- an arguably complete and massive 5-wave Elliott sequence down from Jan’21’s 97.55 high.
Left unaltered by a relapse below at least 67.60 and certainly 66.23, a base/reversal of potentially massive scale may be in its infancy.

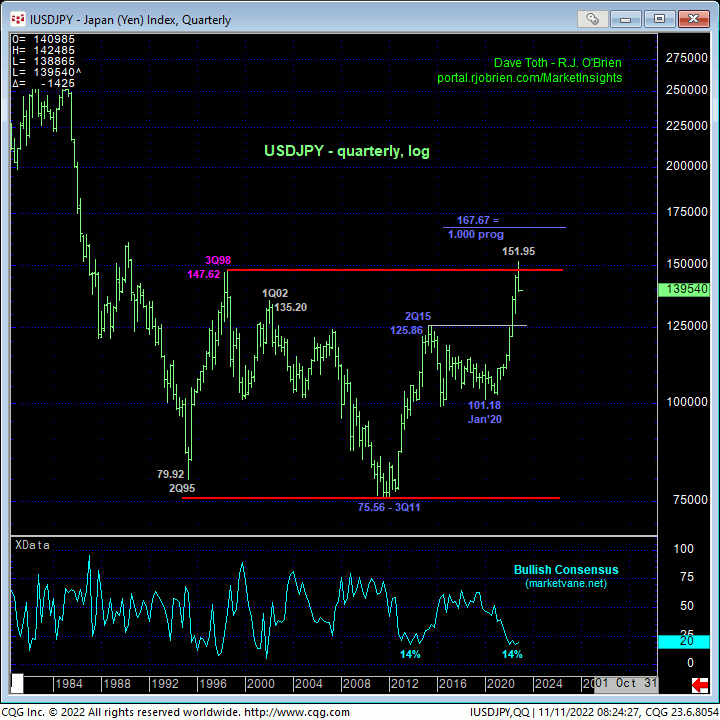
Finally, moving out to an even longer-term scale, the quarterly log scale chart of the underlying cash USDJPY market shows the USD poking to new 24-YEAR highs above 1998’s 147.62 high only to failure miserably to sustain those new highs thus far. Obviously, it would be premature to conclude the end of an 11-year secular bull trend up in the USD from 2011’s 75.56 low following just a couple weeks’ worth of setback. But until the USD recoups 21-Oct’s 151.95 high and the yen relapses below 66.23, the technical elements for a potentially major base/reversal environment for the yen are in place.
The next challenge will be navigating the end of this 1st-Wave rally ahead of a likely 2nd-Wave corrective rebuttal back down, but we will tackle that after the market arrests the clear and present uptrend with a countering bearish divergence in momentum. In lieu of such action, all previously recommended bearish exposure and policy have been nullified and traders are advised to move to a neutral/sideline position. “Chasing” bullish exposure on the initial counter-trend rally presents poor risk/reward metrics, but higher prices are anticipated straight away. For those willing to initiate bullish exposure “up here”, today’s 70.47 very minor corrective low serves as a very tight but objective mini bull risk parameter from which to do so.


