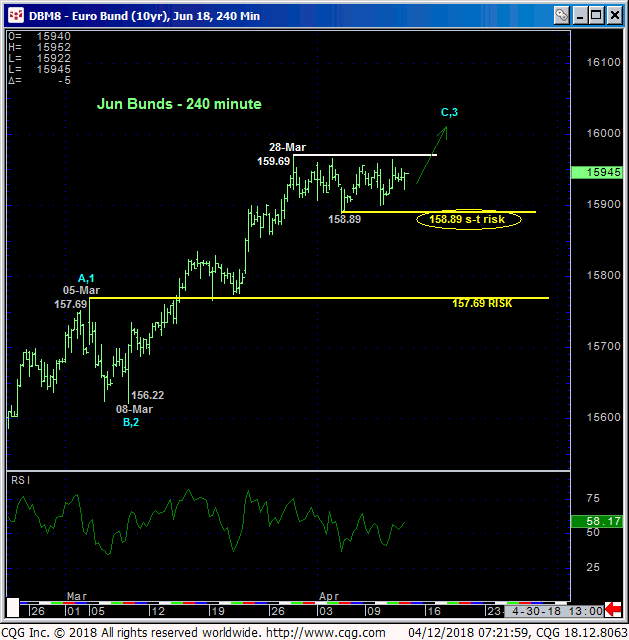
On the heels of Mar’s nice uptrend the past couple weeks’ mere lateral chop looks to be about as bull-market-corrective as it gets. Or so it would seem. And clearly, a failure below 05-Apr’s 158.89 lower boundary to this pattern would threaten a corrective count in favor of a peak/reversal one, so that 158.89 level is considered our new short-term risk parameter from which shorter-term traders with tighter risk profiles can objectively rebase and manage the risk of a still-advised but interim bullish policy ahead of a resumed rally to new highs above 159.69.


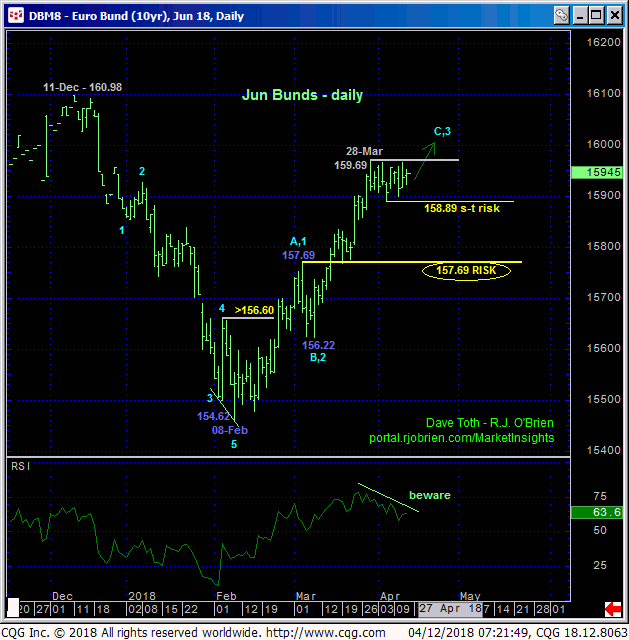
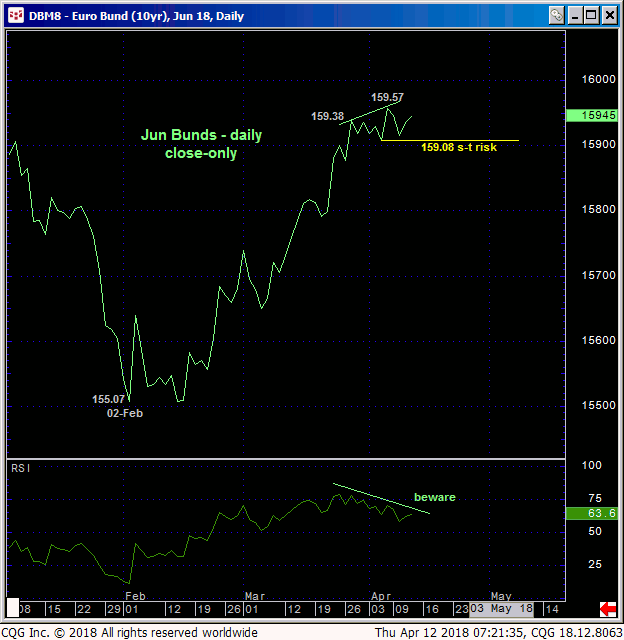
The daily chart above shows these past couple weeks’ corrective chop within the context of our interim bullish count resurrected in 14-Mar’s Technical Blog that should not surprise at all by its continuance. On a daily close-only basis below however, this bull did resume with 06-Apr’s 159.57 new high close above 27-Mar’s 159.38 previous high, creating the very nice POTENTIAL for a bearish divergence in momentum. A close below 05-Apr’s 159.08 corrective low close or a break below 05-Apr’s 158.89 intra-day low will be considered sufficient proof of a mo failure to threaten the uptrend and expose a larger-degree correction or more significant reversal lower, warranting defensive measures like long-covers and cautious bearish punts.

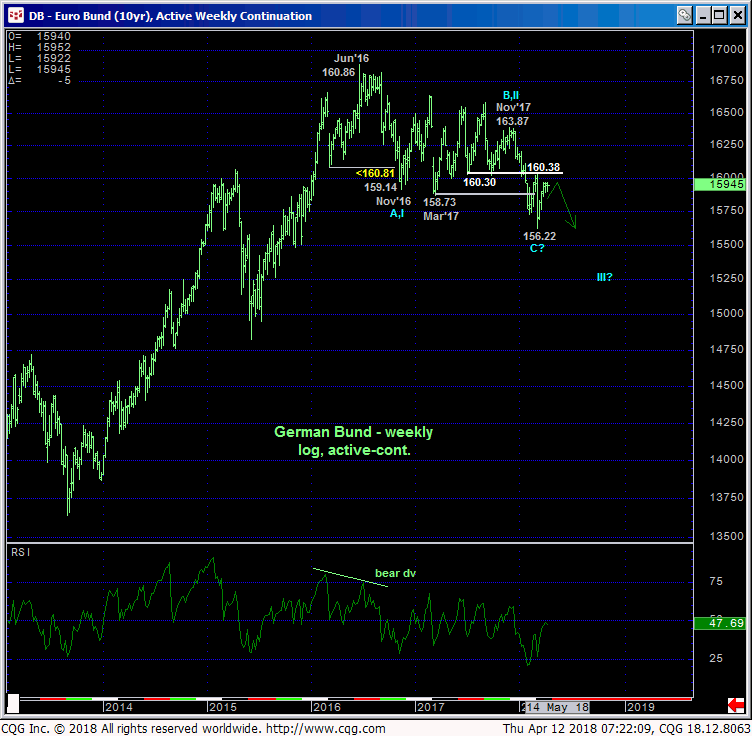
Traders are urged to be suspicious of ANY momentum failure “up here” as the market approaches a huge former support-turned-resistance area around the 160-handle on a weekly log active-continuation basis below. For IF the decline from Nov’17’s 163.87 high is a (3rd-Wave) component of what we believe to be a new secular bear trend in interest rate markets globally, then that ton of former 160-handle-area support would be expected to now hold as new resistance after Jan/Feb’s resumption of a year-and-a-half downtrend below it. IF, alternatively, the Jun’16 – Feb’18 decline is only a 3-wave and thus corrective structure ahead of a resumption of the secular bull to eventual new highs above 161, then, minimally, the past couple months’ uptrend needs to break that 160-handle and perform impulsively higher. So, from a long-term perspective, the market’s engaging a quite important 159/160-area and acute condition where even an admittedly short-term momentum failure could have long-term implications to the bear side.
These issues considered, a cautious bullish policy remains advised with a failure below 158.89 threatening this call enough to warrant moving to a neutral/sideline position in order to circumvent the depths unknown of an interim correction or more significant reversal lower. In lieu of such sub-158.89 weakness, further gains to at least another round of new highs above 159.69 should not surprise.


