DEC E-MINI S&Ps
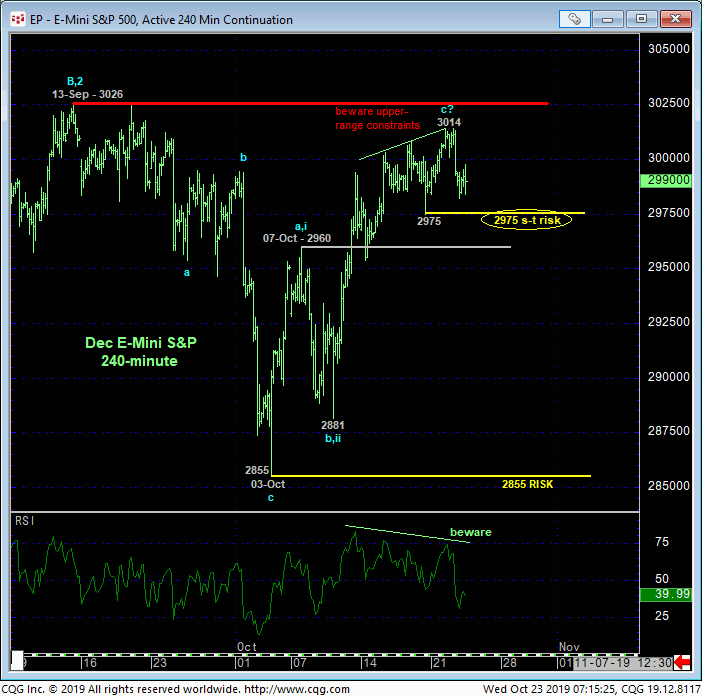
Waning momentum at the extreme upper recesses of a well-established range provides a warning of a pending, if intra-range vulnerability to another corrective relapse. As a direct result of yesterday’s continued rally, the 240-min chart below shows that the market has identified last Fri’s 2975 low as the latest smaller-degree corrective low and level the market is now required to sustain gains above to maintain a more immediate bullish count. It’s failure to do so will confirm a bearish divergence in momentum, stem the rally and expose at least an interim correction lower. Per such, traders are advised to use 2975 as our new short-term risk parameter from which a still-advised bullish policy can be objectively rebased and managed.
This 240-min chart also shows former 2960-area resistance from 07-Oct that cannot be overlooked as a new support candidate, but once below 2975, there would really be no way to gauge the market’s downside potential What we would know with specificity however is the level the market would have to recover above to nullify any further bearish count: yesterday’s 3014 high.
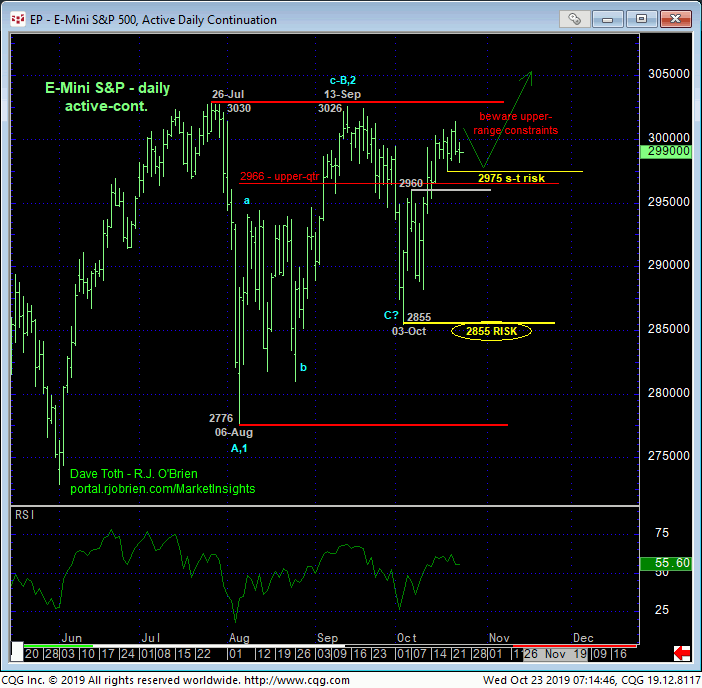
The daily chart above shows the market’s precarious position at the extreme upper recesses of the past quarter’s range that presents a slippery slope for bulls “up here”. We experienced this exact predicament in mid-Sep before the late-Sep steeper corrective but intra-range plunge to 3-Oct’s 2855 low that remains intact as our key long-term risk parameter to a still-advised bullish policy for longer-term players.
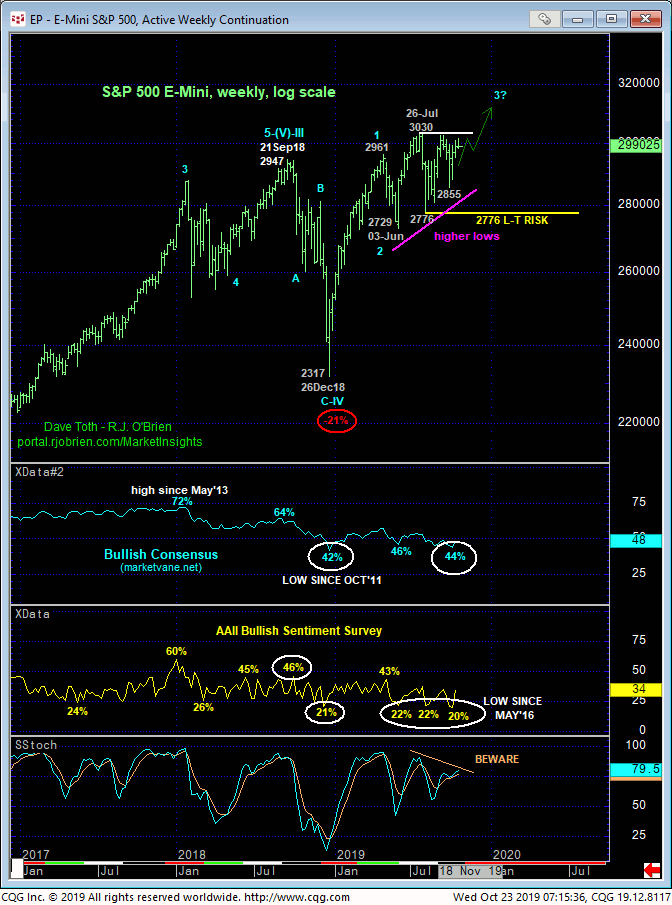
Still reinforcing a long-term bullish count are three technical facts:
- the secular bull trend remains as a backdrop
- despite very labored gains since early-Jun, each successive relapse attempt has stalled at a HIGHER level
- historically BEARISH sentiment/contrary opinion levels DESPITE the market within a stone’s throw of all-time highs.
This last, sentiment factor is most important as all markets have a very, very poor record of rewarding so many bears (in this case) so close to the start of a major move down. From a contrary opinion theory perspective, especially against the backdrop of the secular bull trend, we believe this factor warns of an eventual resumption of this secular bull to new all-times highs above 3030 and a vulnerability to higher prices. Does this preclude another intra-range setback if the market fails below 2975? No. But traders are reminded that such a sub-2975 mo failure is of a SHORTER-TERM scale sufficient to conclude the end of only the uptrend from 03-Oct’s 2855 low. Nothing more, nothing less.
These issues considered, a bullish policy remains advised with a failure below 2975 required for shorter-term traders to move to the sidelines and for longer-term players to pare bullish exposure to more conservative levels. Commensurately larger-degree weakness below 2855 remains required to threaten our long-term bullish count enough to warrant long-term players to move to the sidelines to circumvent the depths unknown of a larger-degree correction or reversal lower. In lieu of such weakness further gains should not surprise.
DEC 10-Yr T-NOTES
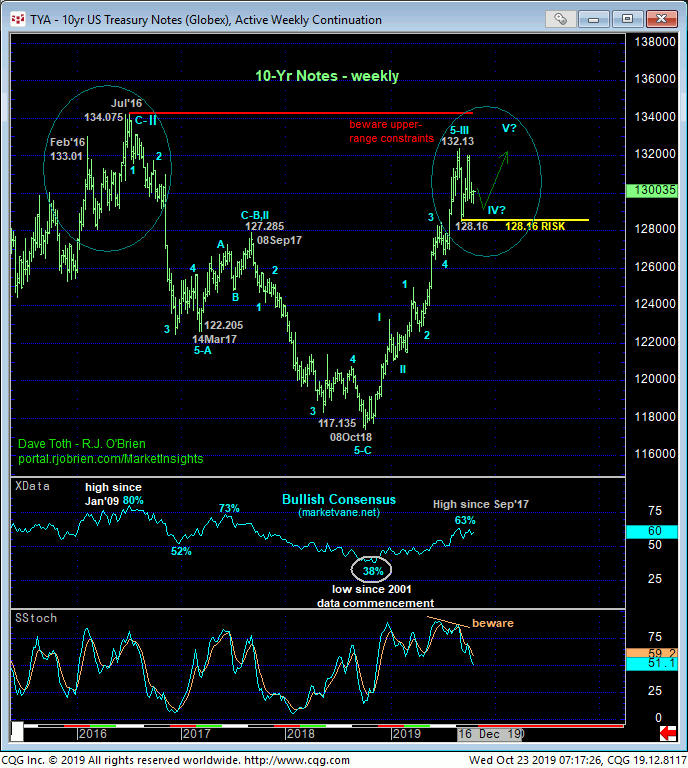
Not surprisingly given the relatively decent inverse correlation between equities and rates, the 240-min chart of the Dec T-Notes below shows waning downside momentum near the lower-quarter of the past couple months’ lateral chop that is first approached as a broader bull market correction. The past week’s continued erosion leaves 14-Oct’s 130.19 high in its wake as the latest smaller-degree corrective high this market needs to sustain losses below to maintain a more immediate bearish count. Its failure to do so will confirm a bullish divergence in momentum, break the downtrend from 04-Oct’s 132.01 high and expose at least an intrarange corrective rebuttal higher.
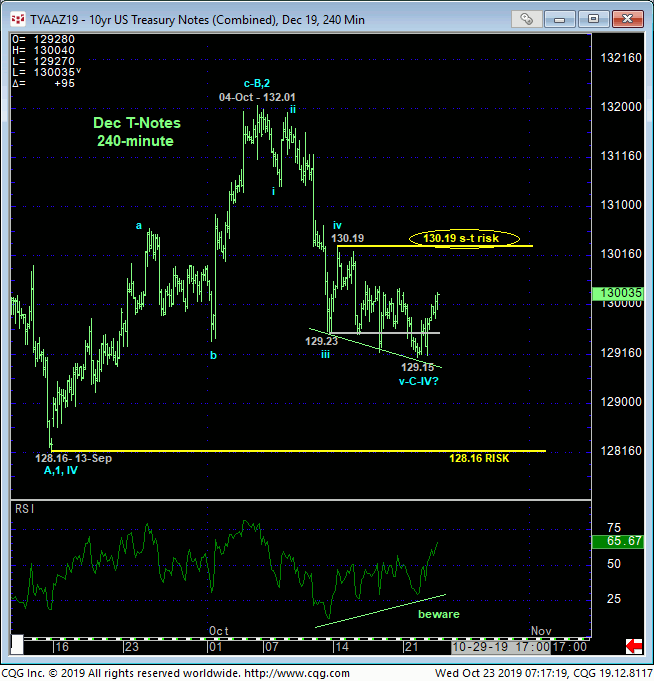
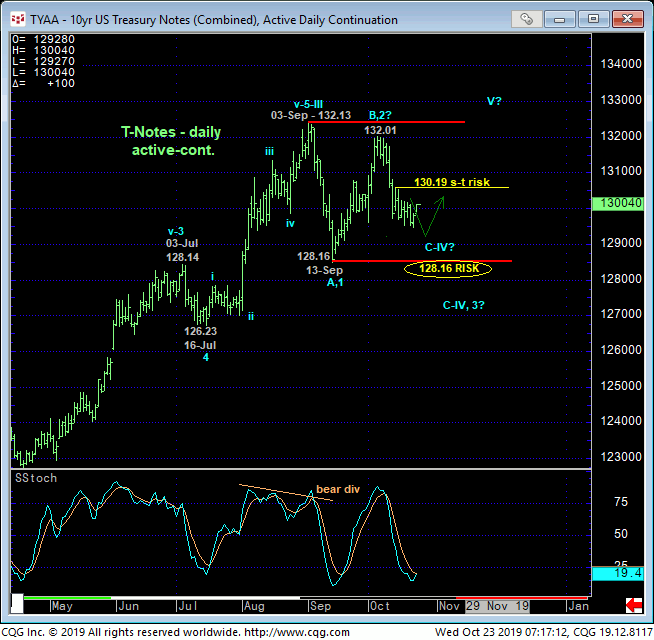
A recovery above such a nondescript level like 130.19 could be chalked up to intra-range chop. But given the magnitude of the past YEAR’S secular uptrend, the more this market simply marks time laterally, we believe the greater the odds are that such lateral behavior is corrective/consolidative ahead of an eventual resumption of that major bull trend that preceded it. And given the relative inverse correlation between stocks and Treasuries, we’d find it difficult to believe that S&Ps won’t fail below 2975 and correct further if Dec -Notes are resuming the past year’s bull trend to new highs above 132.13.
These issues considered, a bullish policy remains advised for long-term players with a failure below 13-Sep’s 128.16 pivotal low and key long-term risk parameter required to warrant neutralizing all exposure and consider a new cautious bearish policy. A cautious bearish policy remains advised for shorter-term traders with a recovery above 130.19 required to negate this call, warrant its immediate cover ahead of at least further intra-range lateral-to-higher prices and possibly a resumption of the secular bull to new highs above 132.13. In effect, we believe this market has identified 130.19 and 128.16 as the key directional triggers heading forward.
