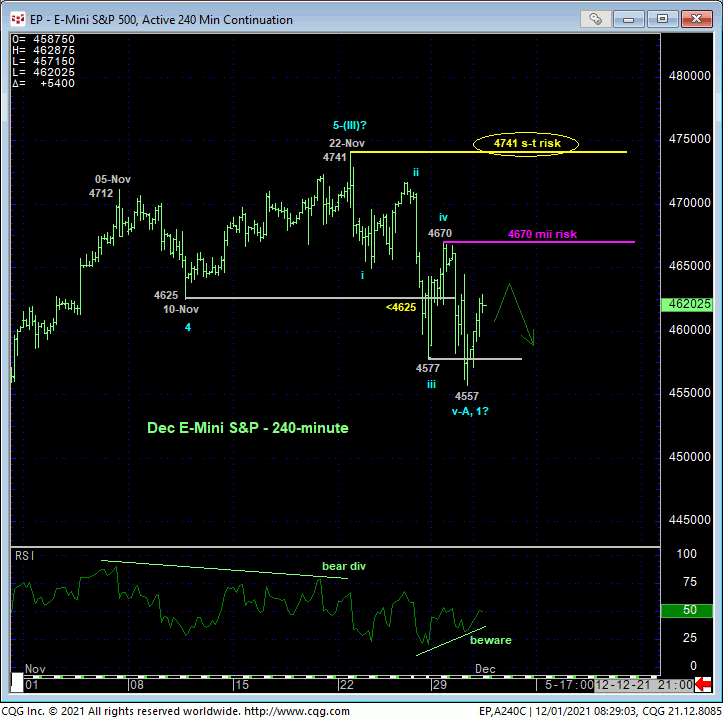
In Fri’s Technical Webcast we discussed that day’s break below 10-Nov’s 4625 corrective low that confirmed a bearish divergence in momentum. This mo failure defined 22-Nov’s 4741 high as one of developing importance and, as we’ll discuss below, the END of a textbook 5-wave Elliott sequence from 01-Oct’s 4260 low. This is a technical fact that defines that 4741 high as THE high this market now must recoup to confirm the sell-off attempt as another correction and reinstates the secular bull trend. Per such, 4741 serves as our new short-term risk parameter from which traders can objectively base non-bullish decisions like long-covers and cautious bearish punts.
The 240-min chart below also shows yesterday’s break below Fri’s 4577 low that reaffirms the developing intermediate-term downtrend. The resulting fact from this resumed weakness is the market’s definition of Mon’s 4670 high as a smaller-degree corrective high and minimum level this market now needs to recoup to break the past week-and-a-half’s downtrend and expose at least a corrective retest of the 4741 high or a resumption of the secular bull to new highs above 4741. Per such, Mon’s 4670 high serves as an even tighter “mini” risk parameter around which short-term traders can effectively and objectively manage non-bullish decisions like long-covers and cautious bearish punts. Until this market can recoup at least 4670, at least the intermediate-term trend is down and should not surprise by its continuance or acceleration. This will obviously be reinforced by another level or degree of weakness below yesterday’s 4557 low.
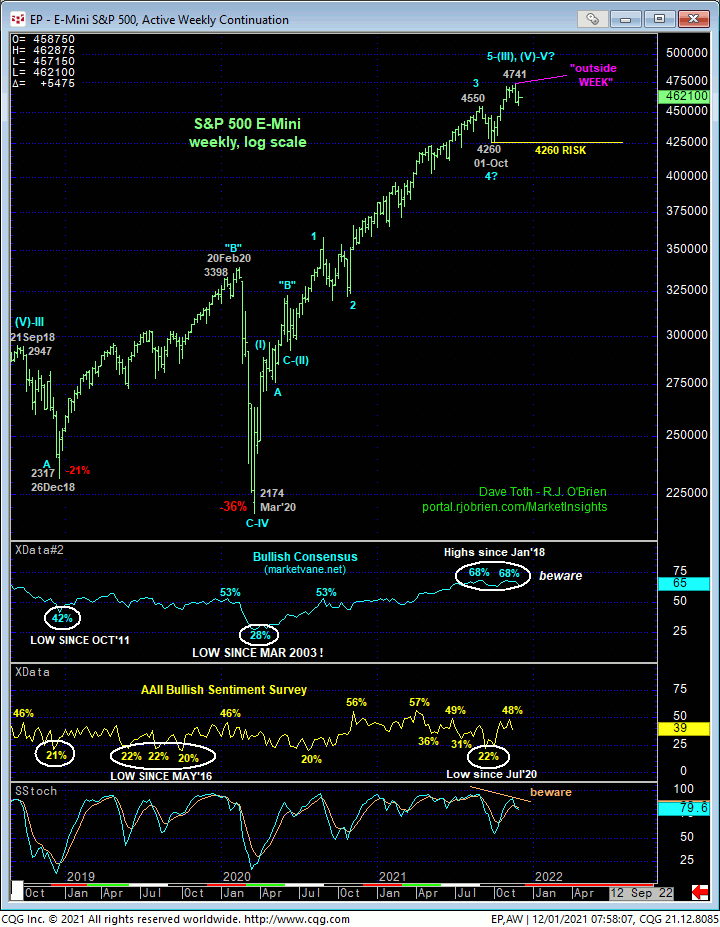
As always and of course, we cannot conclude a larger-degree peak/reversal threat from proof of only smaller-degree weakness. Indeed, only a glance at the weekly log chart below is needed to see that a failure below 01-Oct’s 4260 larger-degree corrective low remains required to, in fact, confirm a bearish divergence in weekly momentum and break the secular bull market, exposing potentially extensive losses below that point. But as such sub-4260 weakness would represent more than a 10% loss from 22-Nov’s 4741 high, the break of which would expose indeterminable and potentially massive losses, longer-term institutional players and investors are urged to acknowledge:
- larger-degree momentum failures below a level like 4260 always begin with smaller-degree momentum failures like last week’s
- smaller-degree momentum failures identify SPECIFIC HIGHS and smaller-degree risk parameters the bull is required to recoup to threaten and then negate a peak/reversal prospect where
- whipsaw risk (back above levels like 4670 and 4741) is acknowledged and accepted in exchange for much deeper nominal risk below a level like 4260.
In other words, smaller-degree weakness like the market has confirmed over the past week puts us on ALERT to be on the lookout for longer-term weakness that could develop into a major rout. The weekly log chart below shows:
- clearly waning upside momentum amidst
- historically frothy sentiment/contrary opinion levels and
- a potentially complete and massive 5-wave Elliott sequence up from Mar’20’s 2174 low, and
- an “outside WEEK” (higher high, lower low and lower close than the previous week’s range and close)last week.
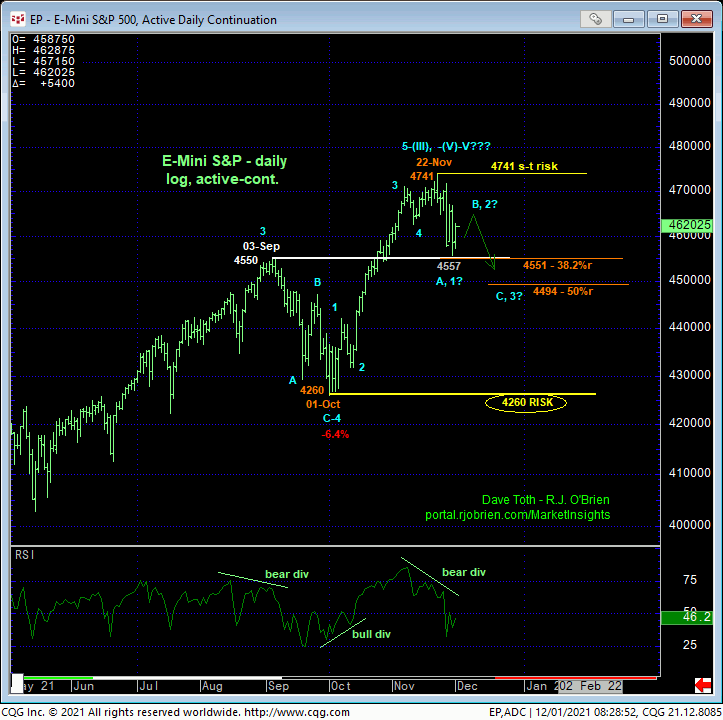
These are technical elements typical of major peak/reversal environments. This said, the daily log chart above shows the recent relapse thus far holding at a rather acute area defined by former 4550-area resistance-turned-support from early-Sep and the (4551) 38.2% retrace of Oct-Nov’s 4260 – 4741 rally. This is an area we’d expect to “hold” as support to a correction ahead of a continuation of the secular bull trend. A recovery above 4670 would reinforce this bullish count while further gains above 4741 will confirm it and exposes potentially steep gains thereafter.
By the same token, resumed weakness below yesterday’s 4557 low would confirm another level of weakness that would reaffirm the current slide, the scope of which would be indeterminable and potentially extensive.
In sum, the market has at least arrested the secular bull trend and has specified levels like 4670 and 4741 it needs to recoup to threaten and then negate a larger-degree correction or reversal and re-expose the secular bull market. Until and unless such strength is shown, these levels serve as tight but objective shorter-term risk parameters from which traders can pare or neutralize bullish exposure in order to circumvent the depths unknown of a larger-degree correction or perhaps a major reversal lower. Longer-term institutional players and investors must be aware that the technical elements typical of major peak/reversal environments are in place. Further reinforcing proof of such would come from further weakness below 4557. Recent and certainly further weakness gives longer-term players and investors the opportunity to pare bullish exposure to more conservative levels in exchange for much deeper nominal risk below 4260 that, if broken, we believe would end the secular bull market and expose a reversal lower that could be massive in scope. We will, of course, monitor the market’s near-term behavior around these levels and update customers accordingly. In the meantime, understanding the merit and function of these specified levels helps immensely with effective and objective risk management.