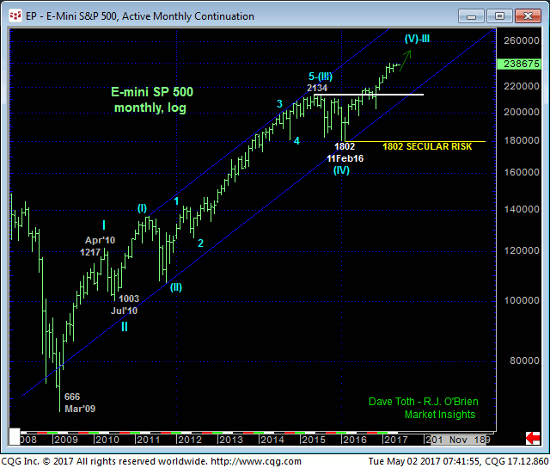
Since 24-Apr’s recovery above 10-Apr’s 2364 high we identified as the level the market needed to recover above to mitigate a more immediate bearish count and perhaps resurrect the secular bull, the 240-min chart below shows that the market has thus far maintained its intermediate-term uptrend. Furthermore and as a result of yesterday’s rebound, the relapse attempt from last week’s 2395 high to yesterday’s 2377 low looks like a corrective bull-flag pattern that warns of a continuation of the past couple weeks’ uptrend to at least one more round of new highs above 2395, the break of which would almost immediately expose 01-Mar’s 2401 all-time high.
A failure below 2377 won’t necessarily result in a steeper intra-range relapse. But given the magnitude of a TWO-MONTH lateral range and a gap resulting from 24-Apr’s higher open that we believe would be odd to remain open from the depths of a merely lateral, choppy environment, we believe the market’s current position so close to the 2-month range cap to be a very slippery slope for bulls.
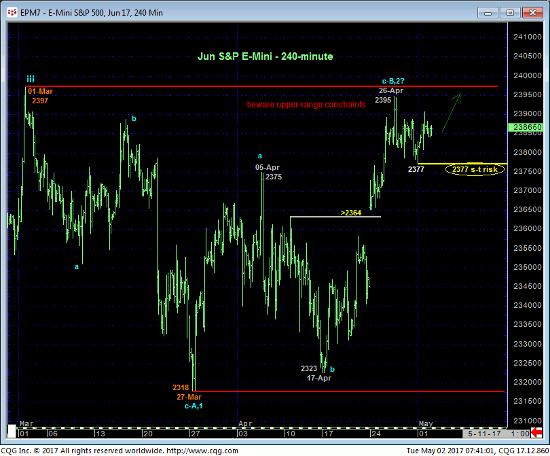
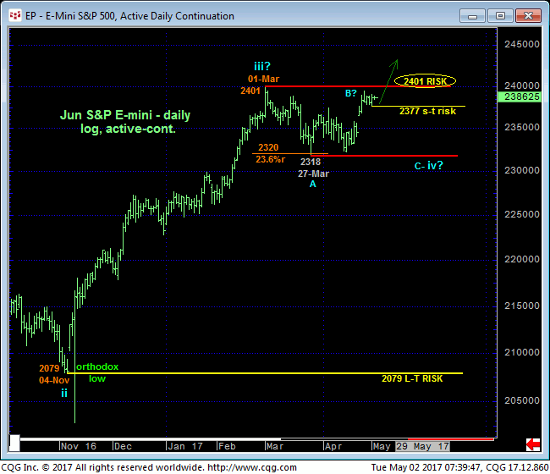
The daily bar (above) and close-only (below) log scale charts show the market’s precarious position just beneath proven resistance. If there’s a place and time for this market to fail, we believe it is here and now. But a failure below 2377 specifically is minimally required to threaten the intermediate-term uptrend and expose another intra-range relapse that could be relatively extensive, including a run at its lower-quarter 2337 or lower.
By the same token the market is only a stone’s throw away from breaking above last week’s 2395 high AND 01-Mar’s 2401 all-time high and reinstating the secular bull trend. And given a Fibonacci MINIMUM 23.6% retrace of the entire rally from 04Nov16’s 2079 low to that 2401 all-time high, it is not hard at all to find evidence to that this mega-bull trend is as strong as it’s ever been.
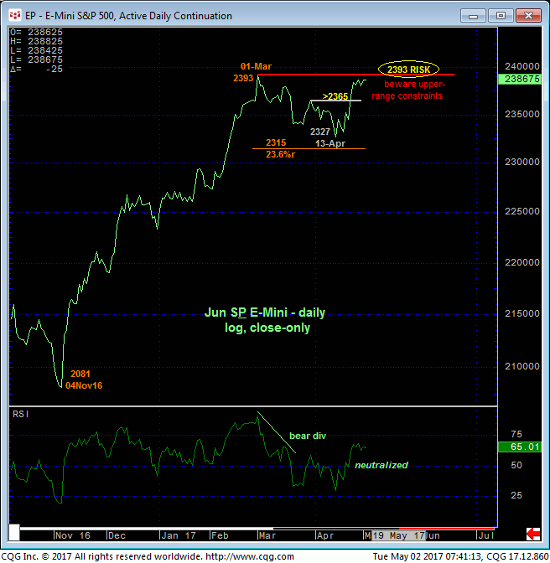
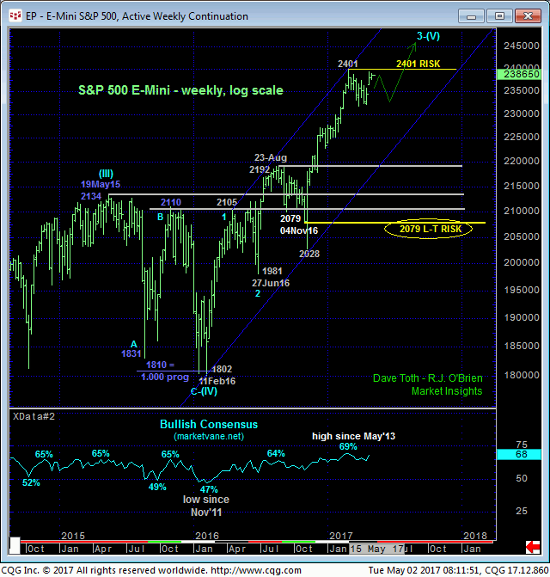
Indeed, from a long-term perspective looking at the weekly (above) and monthly (below) log scale charts, the past couple months’ mere lateral chop hardly registers against the secular advance. On this long-term scale a failure below former 2192-area resistance-turned-support is MINIMALLY required to even threaten the bull, let alone negate it.
These issues considered, we believe the market has identified 2401 and 2377 as the key directional triggers heading forward. A bust-out above 2401 will reinstate the secular bull and warrant returning to a full bullish policy ahead of indeterminable gains. Conversely, a failure below 2377 will threaten the past couple weeks’ uptrend and expose another intra-range relapse that could be relatively steep, including a run at the lower-quarter of this range between 2337 and 2318. Shorter-term traders are advised to toggle directional biases and exposure around this 2377 short-term risk parameter.
