Posted on Feb 27, 2023, 06:36 by Dave Toth
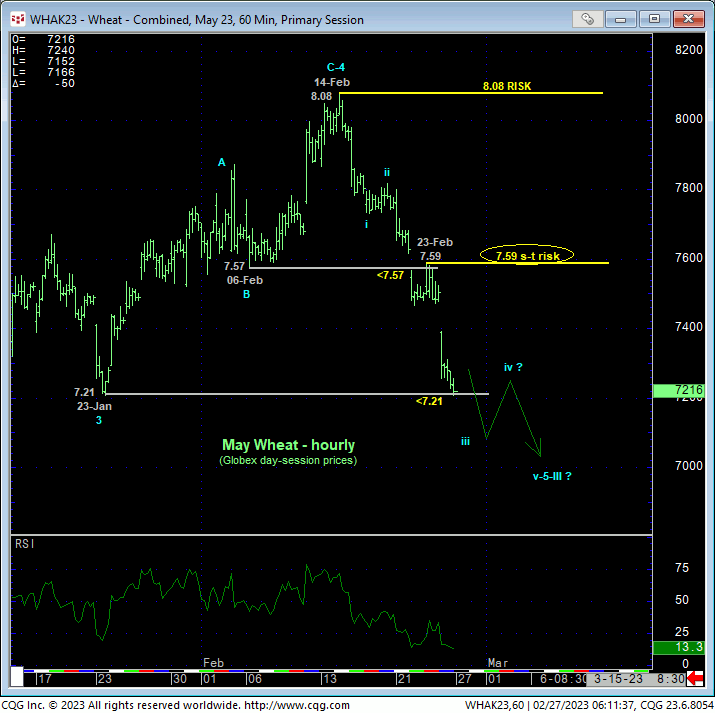
In last Wed’s Technical Blog we discussed that day’s momentum failure below 06-Feb’s 7.57 corrective low that rendered Jan-Feb’s recovery attempt to 14-Feb’s 8.08 high a 3-wave and thus corrective affair that warned of a resumption of the major bear market from May’22’s high. Fri and overnight’s break below 23-Jan’s 7.21 low confirms this count and leaves smaller- and larger-degree corrective highs in its wake at 7.59 and 8.08 that this market is now required to recover above to threaten and then break this major bear trend. Per such, these levels serve as our new short- and long-term parameters from which the risk of a continued or resumed bearish policy and exposure can be objectively based and managed.
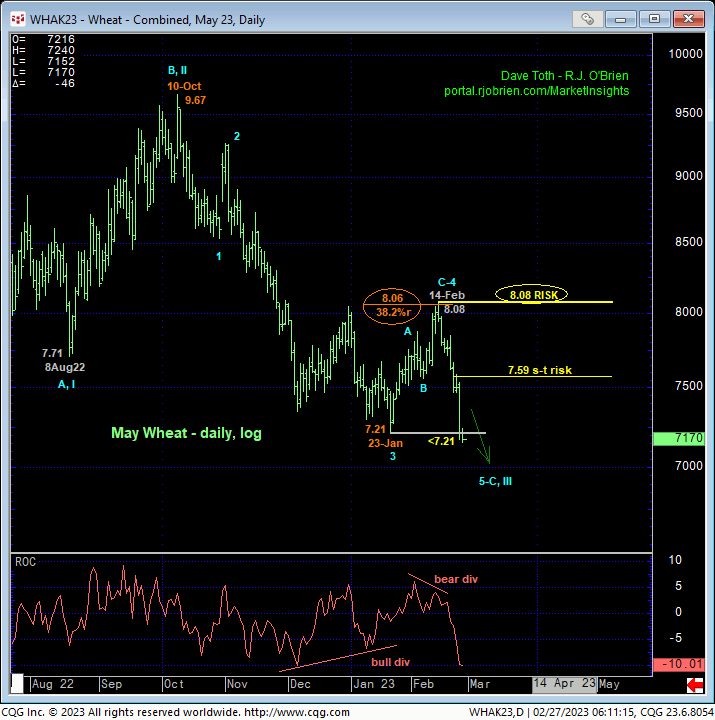
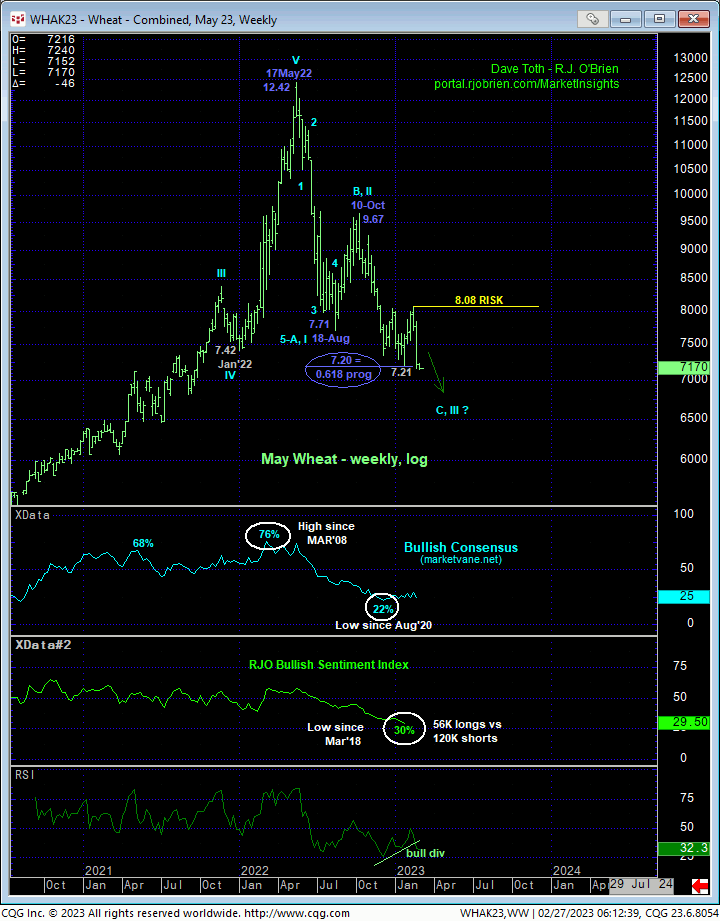
The daily (above) and weekly (below) log scale charts of the May contract show the resumption of what now is a 9-month, $5.27, 42% decline in the May23 contract following a textbook 3-wave, 38.2% correction of Oct-Jan’s 9.67 – 7.21-portion of this major bear market. To even defer the new secular bear market, commensurately larger-degree strength above 14-Feb’s 8.08 larger-degree corrective high is clearly required.
Furthermore, by breaking 23-Jan’s 7.21 low, the market has exposed an area totally devoid of any technical levels of merit. In effect, there is no support. The only levels of any technical merit currently exist only ABOVE the market in the form of former 7.21-to-7.35-area support-turned-resistance and prior corrective highs at 7.59 and 8.08. In this regard, the market’s downside potential is considered indeterminable and potentially extreme.
Yes, market sentiment/contrary opinion is at historically low levels typical of major BASE/reversal conditions. But we would remind traders that contrary opinion is not an applicable technical tool in the absence of an accompanying confirmed bullish divergence in momentum. Herein lies the importance of recent corrective highs and risk parameters, even a short-term level like 7.59.
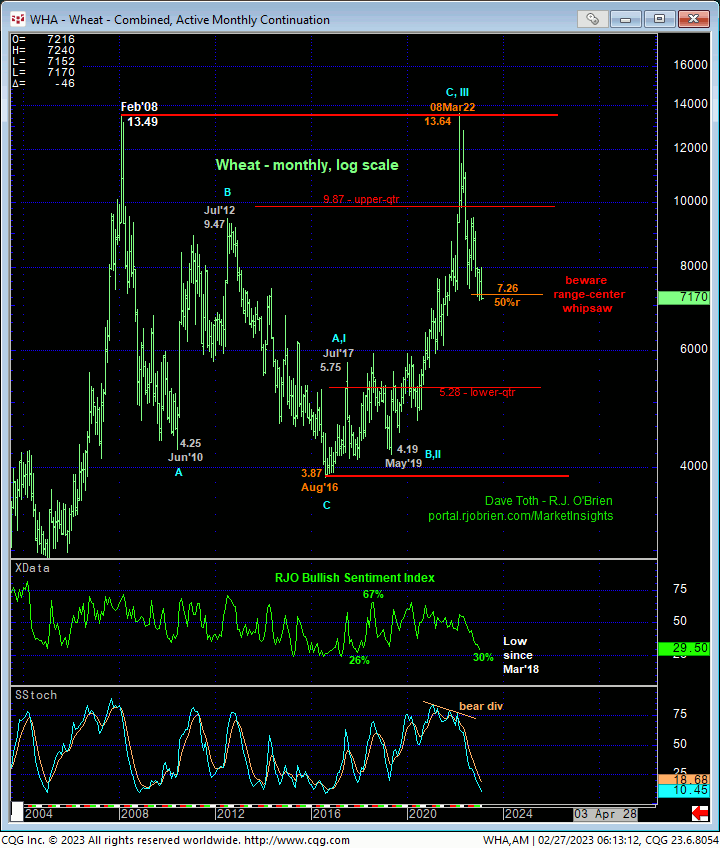
Finally and on an even longer-term basis, the monthly log active-continuation chart below shows the market’s position deep within the middle-half bowels of its massive but lateral historical range. We always warn of the great odds of aimless whipsaw risk from such a condition and herein lies the importance of identifying tighter but objective parameters from which to manage the risk of a bearish policy. But this chart also shows the history of outlier moves like 2007-2008 and the repercussions thereafter that warn us to beware of potentially protracted weakness until/unless arrested by a confirmed bullish divergence in momentum above a prior corrective high of significance like 8.08.
These issues considered, the trend is down on all scales and should not surprise by its continuance or acceleration straight away. Both short- and long-term players have been advised to neutralize any remaining bullish exposure by this time and are further advised to move to a new cautious bearish policy and exposure from current 7.20-area prices with a recovery above at least 7.59 required to pare or neutralize this exposure.