JUN JAPANESE YEN
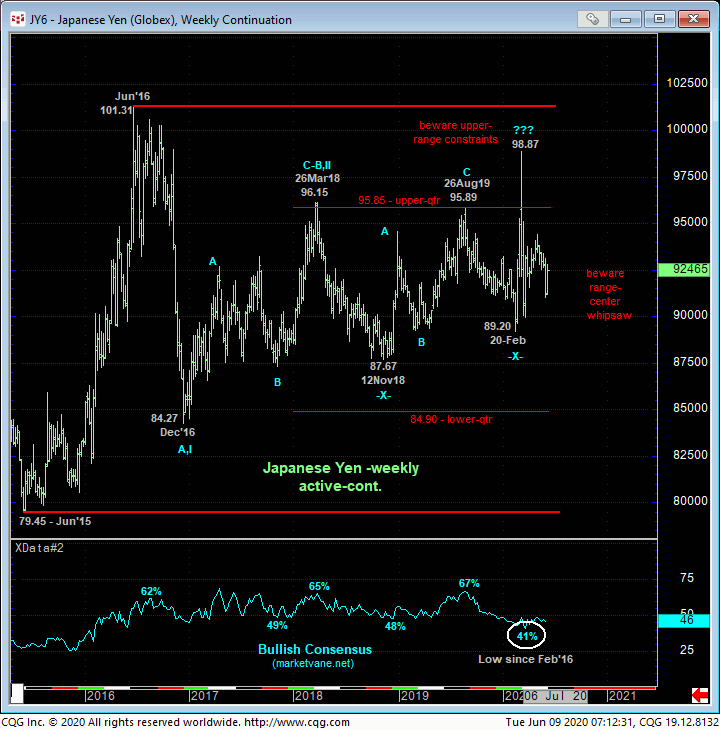
In yesterday morning’s Technical Blog we identified last Thur’s 92.07 smaller-degree corrective high as our new short-term risk parameter for traders to tighten their bear risk given the 1) developing potential for a bullish divergence in momentum and 2) the fact that this market remains deep within the middle-half bowels of its incessant FIVE YEAR lateral range where we always consider the odds of aimless whipsaw as higher. Two hours later, the 240-min chart below shows that the market recovered above 92.07, confirmed the bullish divergence in mo and defined Fri’s 91.03 low as the end of the decline from at least 29-May’s 93.41 next larger-degree corrective high and key longer-term risk parameter.
Per such, Fri’s 91.03 low serves as our new short-term risk parameter from which non-bearish decisions like short-covers and cautious bullish punts can now be objectively based and managed. Clearly, this is the level the market now needs to relapse below to resuscitate a broader bearish count.
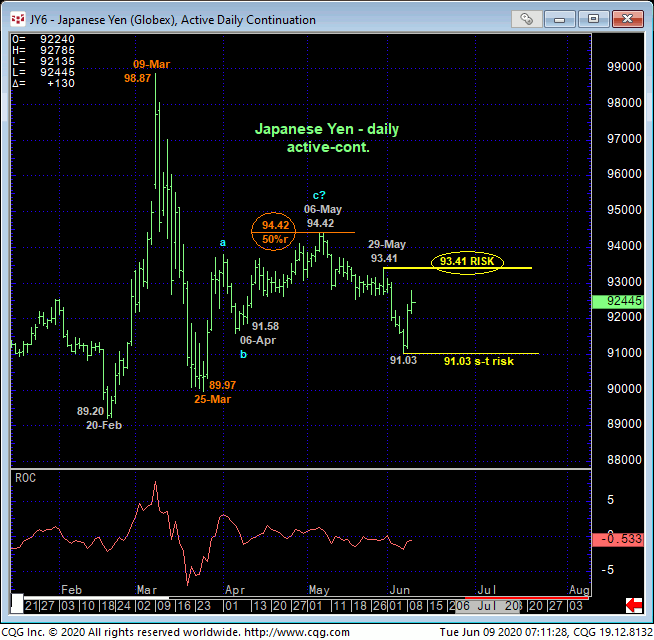
By the same token, when stepping back to consider the clear 3-wave and thus corrective recovery from 25-Mar’s 89.97 low to 06-May’s 94.42 high and exact 61.8% retrace of Mar’s 98.87 – 89.97 collapse, the question/challenge now is discerning whether 06-May’s 94.42 high COMPLETED the correction or just defined its upper boundary ahead of further aimless, lateral chop in the period ahead. While 29-May’s 93.41 larger-degree corrective high and key risk parameter remains intact, so too does the former, more bearish count calling for potentially steep losses below not only last week’s 91.03 low, but also 26-Mar’s 89.97 low. The market’s failure to sustain sub-93.41 levels will negate such a more immediate bearish count and reinforce the latter, lateral consolidative count.
These issues considered, we believe the market has defined 93.41 and 91.03 as the key directional triggers heading forward around which directional biases and exposure should be toggled commensurate with one personal risk profile. Shorter-term traders have been advised to neutralize bearish exposure and are further advised to maintain a neutral/sideline policy while the market is confined to the recent 93.41 – 91.03-range where the risk/reward merits of initiating directional exposure are poor. Longer-term players are OK to maintain a cautious, conservative bearish policy, with a recovery above 91.43 negating this call and warranting its cover. Needless to say, a relapse below 91.03 resurrects a broader bearish count that could see sharp losses thereafter.
JUN CANADIAN DOLLAR
As our yen analysis above address the increased odds of aimless whipsaw risk from the middle-half of broader ranges, traders of all scales are advised to be on the lookout for similar behavior in the Loonie as the weekly chart below shows the market’s recent, impressive, impulsive rally returning it to the smack-dab middle of the middle-half bowels of the 0.6809 – 0.8291-range that has imprisoned it for the past 4-1/2 YEARS. Virtually all of 2019’s price action was a hair-pulling-out nightmare where trend-followers go to die. Traders are urged to keep a close watch on MOMENTUM in the period immediately ahead, where a divergence would at least interrupt the clear and present uptrend and may expose nightmarishly lateral, choppy price action in the period ahead.
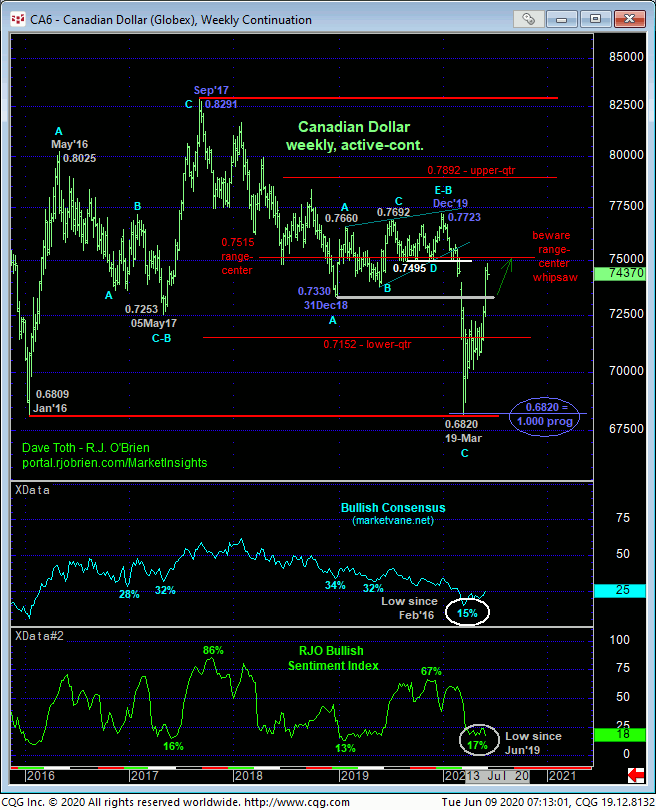
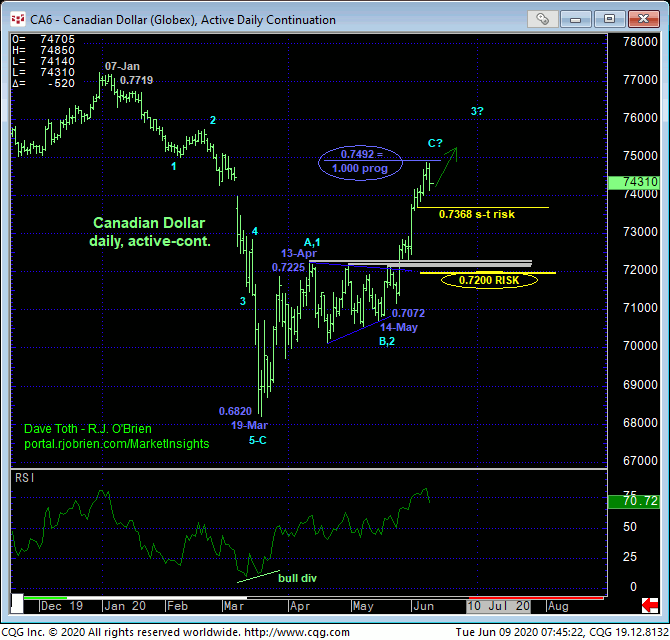
The extent and impulsiveness of the resumed rally from 14-May’s 0.7072 (suspected B-Wave triangle) low is impressive and clearly reaffirms our longer-term base/reversal count. Former and considerable lower-0.72-handle-area resistance shown in the daily chart above now serves as huge new support per any broader bullish count. Per such, we’re identifying 0.7200 as our new long-term risk parameter the market needs to break to threaten a broader bullish count enough to warrant over long-term traders’ move to the sidelines.
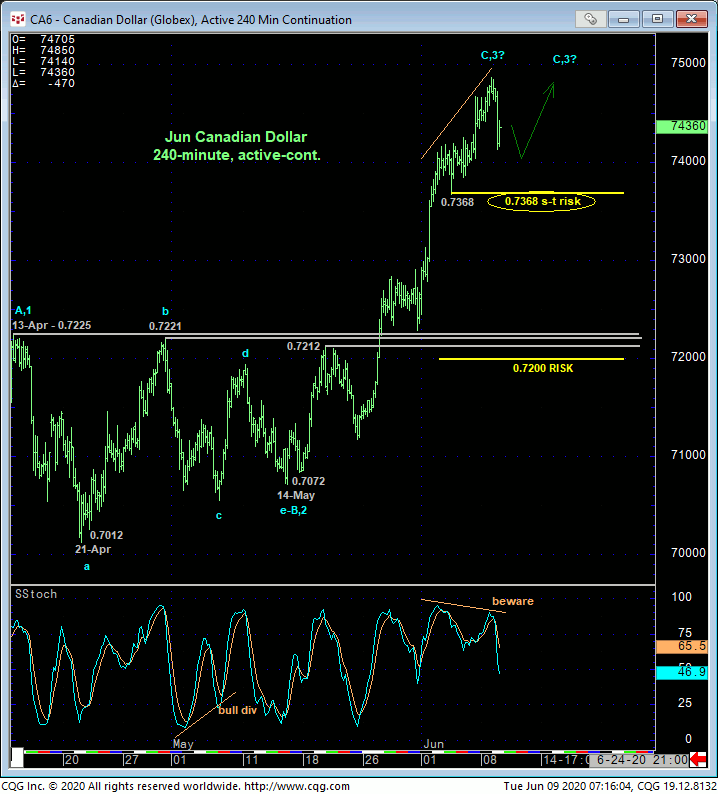
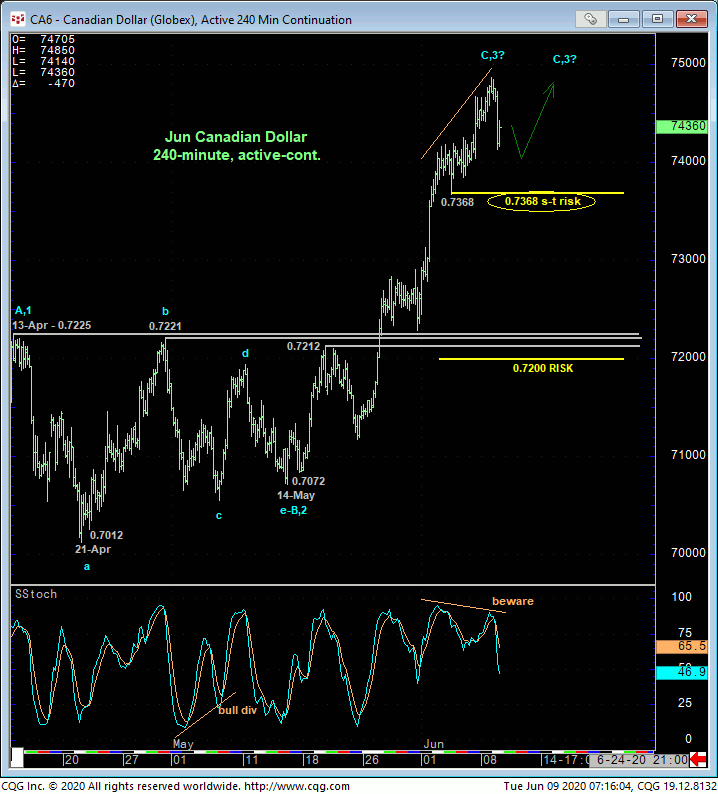
From a shorter-term perspective however, the 240-min chart below shows the developing POTENTIAL for a bearish divergence in momentum. As a result of Fri’s resumption of the bull, this chart shows 03-Jun’s 0.7368 low as the latest smaller-degree corrective low the market now needs to sustain gains above to maintain a more immediate bullish count. Its failure to do so will confirm this bearish divergence in momentum and defer or threaten the uptrend from 0.7072 enough to warrant a move to the sidelines by shorter-term traders in order to circumvent the depths unknown of a bigger correction or reversal lower.
Per this developing but admittedly short-term momentum threat as well as the fact that the market has returned to the middle of the massive four year lateral range, it may also prove important that the resumed (C- or 3rd-Wave) rally from 14-May’s 0.7072 low came within five pips of the (0.7492) 1.000 progression of Mar-Apr’s initial (A- or 1st-Wave) rally from 0.6820 to 0.7225 labeled in the daily chart above. Now as always, we never RELY on merely “derived” technical levels like Fibs to conclude directional decisions in the absence of an accompanying CONFIRMED bearish (in this case) divergence in momentum. And herein lies the importance of 03-Jun’s 0.7368 admittedly smaller-degree corrective low and new specific short-term risk parameter the market needs to sustain gains above to maintain a more immediate bullish count.
These issues considered, a bullish policy and exposure remain advised with a failure below 0.7368 required for shorter-term traders to move to the sidelines and for longer-term players to pare exposure to more conservative levels. Commensurately larger-degree weakness below 0.7200 is required to threaten a long-term bullish count enough to warrant neutralizing remaining exposure. In lieu of at least such sub-0.7398 weakness however, the trend remains up on all practical scales and should not surprise by its continuance.
