Posted on Feb 20, 2024, 09:52 by Dave Toth
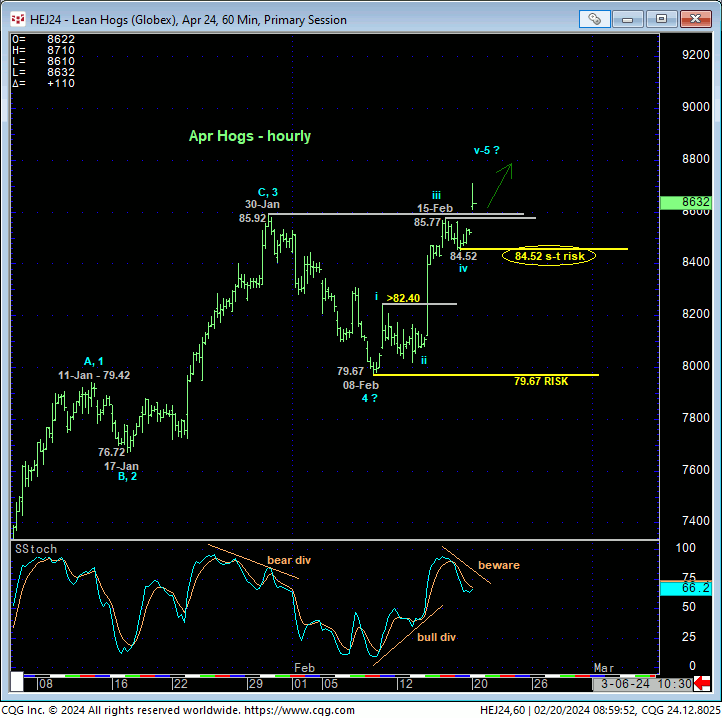
In last Thur’s Technical Blog we discussed the extent and impulsiveness of last mid-week’s rally and the likely break above 30-Jan’s 85.92 high that left 08-Feb’s 79.67 low as a key level of support from which longer-term commercial players could objectively rebase and manage the risk of an interim bullish policy. The hourly chart below shows this morning’s break above that 85.92 high that reinstates and reaffirms the broader recovery from 02-Jan’s 71.70 low that not only confirms 08-Feb’s 79.67 low as a larger-degree corrective low and key longer-term bull risk parameter, but also identifies Fri’s 84.52 low as the latest smaller-degree corrective low. This smaller-degree corrective low at 84.52 can now be used as a short-term parameter from which the risk of a bullish policy and exposure can now be objectively based and managed by shorter-term traders with tighter risk profiles.
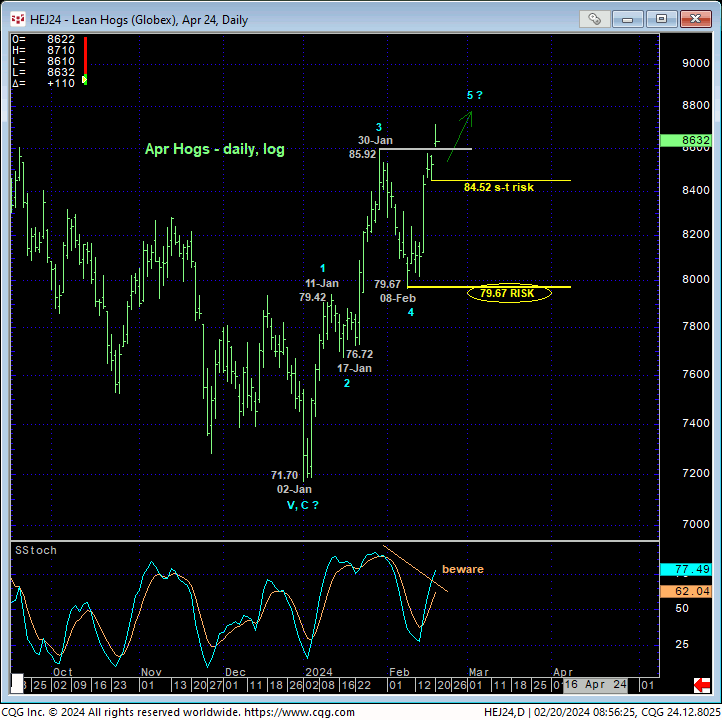
The daily log chart of the Apr contract below shows today’s reaffirmation of the still-developing uptrend from 02-Jan’s 71.70 low to this contract’s highest level since last Jun. The trend is clearly up and should not surprise by its continuance. HOWEVER……
….It’s easy to identify 08-eb’s 79.67 low as a larger-degree corrective low and key longer-term bull risk parameter. But if this market has something broader to the bull side in mind, the bull needs to BEHAVE LIKE ONE “UP HERE” by sustaining trendy, impulsive behavior higher. And it can start by holding above former resistance-turned-support around the 85.92-to-85.77-area that has capped it since late-Jan. Additionally, a relapse below Fri’s 84.52 smaller-degree corrective low will confirm a bearish divergence in short-term momentum and likely complete what would arguably be a textbook 5-wave Elliott sequence up from 79.67 as labeled in the hourly chart above. And such a smaller-degree complete wave sequence could also mean the end of a larger-degree sequence up from 02-Jan’s 71.70 low as labeled in the daily chart below.
As always, we cannot conclude a larger-degree peak/correction/reversal count from admittedly smaller-degree weakness below a corrective low like 84.52. But 1) all larger-degree momentum failure start with smaller-degree mo failures and 2) for shorter-term traders, risking longs to 79.67 is outside of their risk profile. Per such, Fri’s 84.52 low serves as our new short-term bull risk parameter pertinent to shorter-term traders.
Another reason we want to scrutinize and require this market to continue to behave like a bull by sustaining gains above recent corrective lows is that the weekly close-only chart below shows the understandable flood to the bull side by the Managed Money community as evidence by a two month move from 39% to 76% in our RJO Bullish Sentiment Index, its highest reading since Sep when the market accelerated its secular bear market plunge.
We would remind traders however that sentiment/contrary opinion is not an applicable technical tool in the absence of an accompanying confirmed bearish divergence in momentum needed to break the clear and present uptrend. A short-term mo failure below 84.52 is not of a sufficient scale to conclude the end of Jan-Feb’s impressive run, but it would be sufficient for shorter-term traders to neutralize bullish exposure on a failure below 84.52.
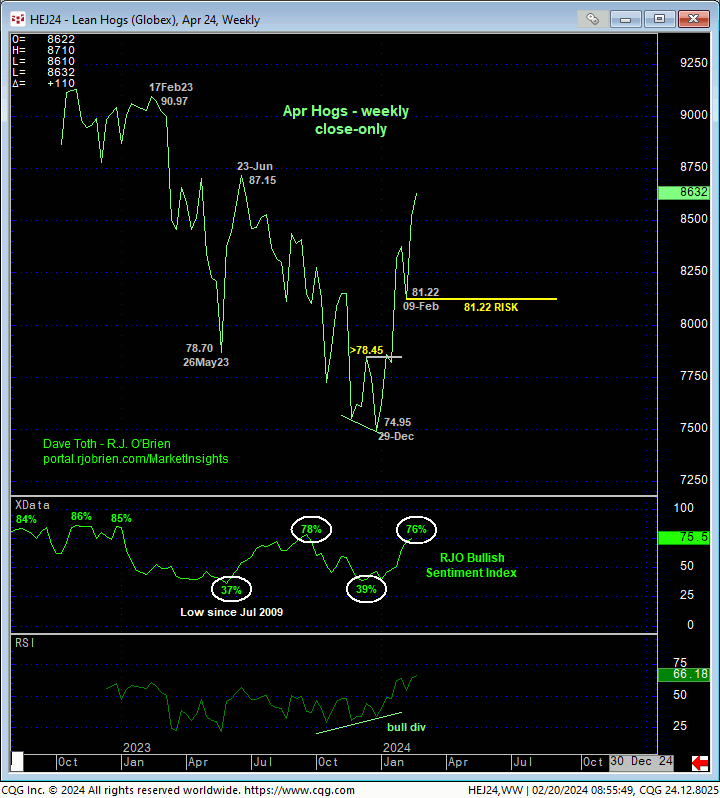
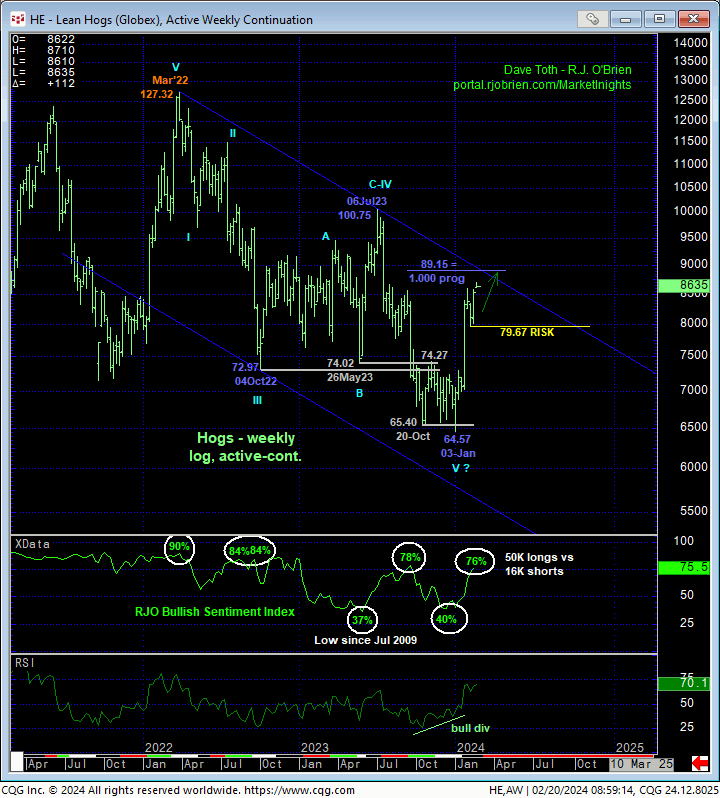
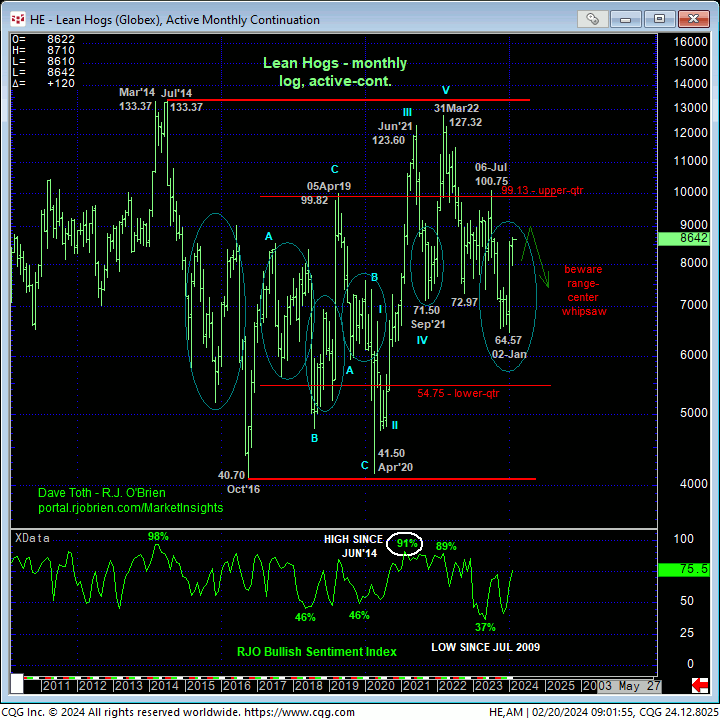
Moving out even further to a weekly log active-continuation chart above, while Jan-Feb’s rally is certainly an impressive one, it would have to rally another 3-cents to equal the span (i.e. 1.000 progression) of Oct’22 – Jul’23’s previous bear market correction. Furthermore, the monthly log active-continuation chart below shows the market’s position still well within the middle-half bowels of its massive but lateral historical range, where the odds of aimless whipsaw risk still must be approached as having a higher weight than the prospect of a sustained, trendy, impulsive move to the upper-quarter of this range above 100.00.
CAN such a trendy, impulsive, directional move to 100+ levels be underway??? Sure. Absolutely. But given these lateral range considerations AND the extent to which the huddled masses are now swarming to the bull side, it is imperative for the bull to keep on keepin’ on straight away. NO, we cannot conclude the end of Jan-Feb’s impressive recovery from a smaller-degree mo failure below 84.52. But we WOULD be able to conclude a smaller-degree high at that point, questioning the risk/reward metrics of a bullish stance sufficiently for shorter-term traders to neutralize exposure.
These issues considered, a bullish policy remains advised with a failure below 84.52 required for shorter-term traders to neutralize exposure and commensurately larger-degree weakness below 79.67 for longer-term commercial players to follow suit. In lieu of such weakness, further and possibly accelerated gains remain expected. But beware.
