Attention New or Frustrated Traders:
Do you want to get into futures trading, but don’t have the time or knowledge necessary to do so? RJO Echo Trading is an intuitive way for investors or “echo followers” to automatically match the performance of veteran and accomplished traders. As an “Echo Follower” you will choose from a selection of vetted and experienced “Echo Leaders”, all you have to do is pay a subscription fee and your account will mimic the trades of your chosen “Leader”. Echo Trading eliminates the learning curve needed to trade futures, making it an option for all.
The Markets
Metals - Gold Follows Stocks, Not the Haven
Gold Follows Stocks, Not the Haven
By: Joshua GravesPosted 05/01/2020
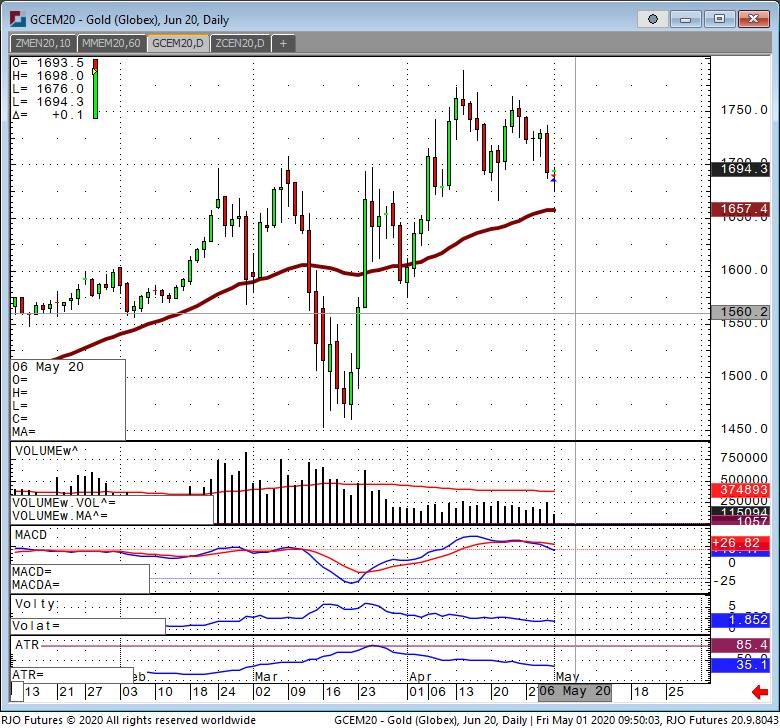
June gold futures have been trading side by side with the equities for most of the big moves we’ve seen in gold recently. When the market is up big, gold seems to be right there with it. I have heard both sides of the argument for why gold is going to 2000 and why gold is going to underperform and stay below 1700 for most of this year. Gold I believe has the potential for a substantial rally above the recent high of 1790, but we need a close firmly above 1800 before that is possible. Traders should be looking at this with skepticism and think, everyone is thinking the same thing regarding the fed. Unlimited money printing with no end in sight, and inflation a real possibility long term. Now, let’s look at the bearish side of this which I would see as a big pullback in demand for gold from India and China specifically. They represent the vast majority of world gold consumption, and the World Gold Council last week announced it was projecting Indian gold demand to drop by 36% in Q3 this year. India is the worlds biggest buyer of gold hence why this is important to watch.
Technical aspects of June gold are mixed at best. Right now, the trade is watching a few key levels. One of which we appear to be at right now with support around 1690. The most important level to watch for the bulls is the recent high of around 1790. Unless this level specifically is taken out you can’t make a case for a bull run beyond that. There must be something new that develops to give the bulls a boost and a stock market selloff won’t do it. We’ve seen that before.
Gold Jun '20 Daily ChartMetals - Silver Biding its Time
Silver Biding its Time
By: Eli Tesfaye, Senior Market StrategistPosted May 1, 2020 10:34AM CT
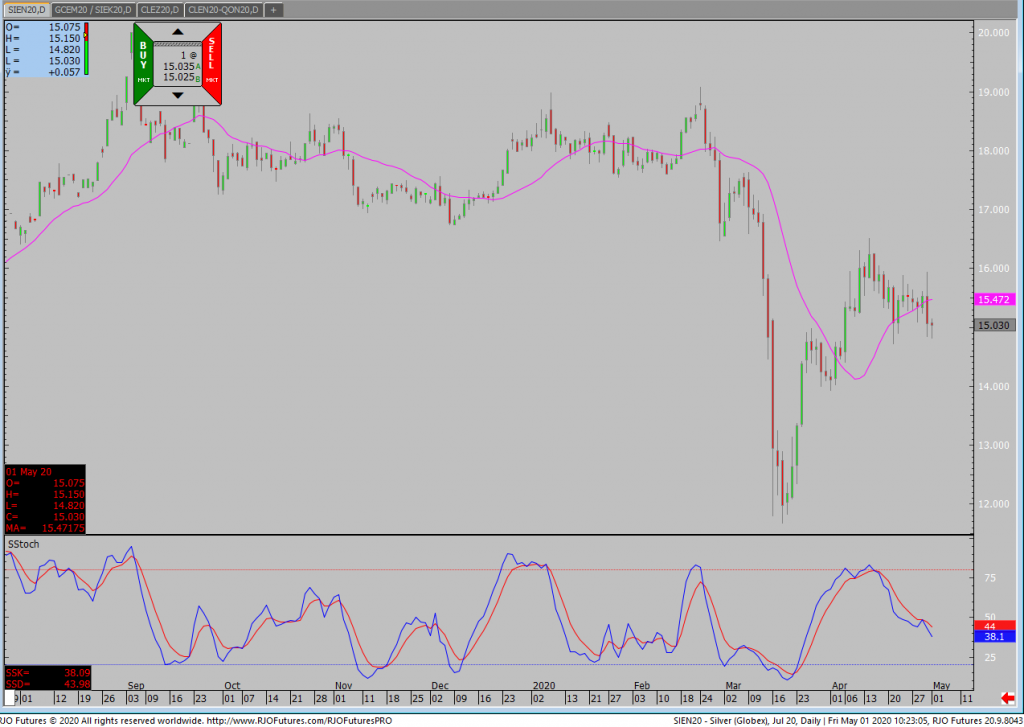
Silver rejected downside pressure and is trying to hold above $15.00 in the front month July contract. After gold/silver ratio hit a staggering high this March, silver is trying to avoid a steep sell-off that took silver below 12.00 last March. As I have stated before, silver is caught in the middle of demand/recession cycle. I still don’t anticipate a huge run up in price, but I do think that some technical levels could trigger an extended short term rally. For the futures, the July contract needs to hold above $15.00 to set another leg up. On the other hand, a shift in global recession sentiment could trigger another wave of selling that could pressure silver below $12.00.
In my view, the sooner we can get a resolution to COVID-19 and people start returning to work, the sooner you will see the price of silver stabilizing. A vaccine for COVID-19 would trigger a friendly rally for silver. Remember the Fed has pumped a lot of liquidity into the economy to make up for lost times. If you are patient, there will be “an inflation” rally. Right now, we are just grinding sideways. Taking a long and or short position could be premature. However, you can employ sideways strategy using options.
Silver Jul '20 Daily Chart If you have any questions or would like to discuss the markets further, please feel free to contact me at 800-367-7290 or etesfaye@rjofutures.com. Energy - Crude Poised For Pressure
Crude Poised For Pressure
By: Aleksandar CuricPosted 04/30/2020
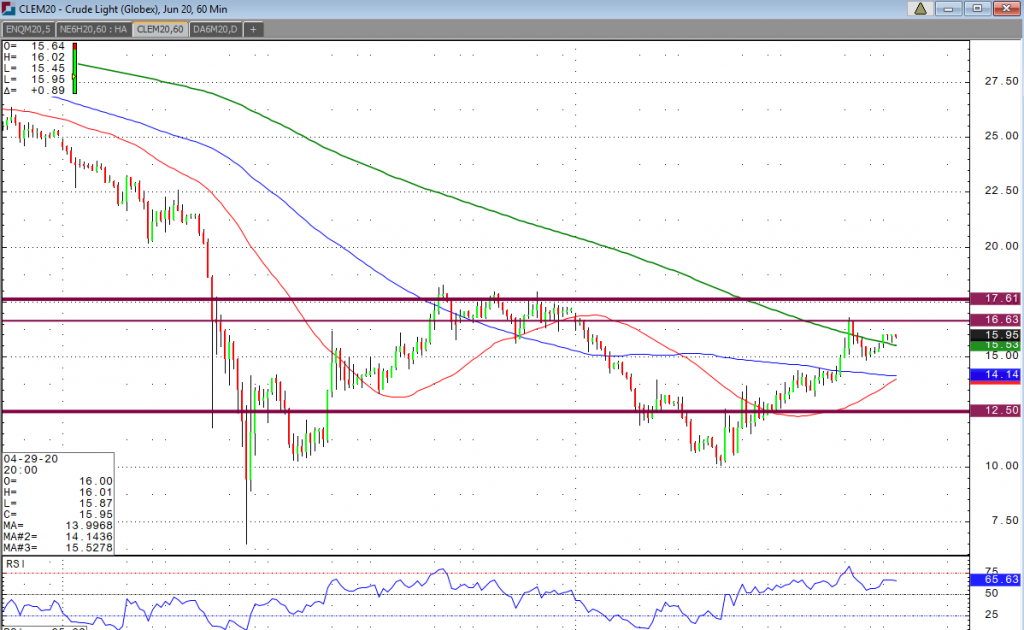
While WTI crude continues to face incredible volatility based off historical supply and demand destruction, it seems traders are hoping the demand recovery will be supported as cities in the states as well as Europe begin to test the waters of reopening. API data yesterday revealed a smaller than expected crude inventory buildup, traders will be watching the more highly regarded EIA report today for a smaller than expected build up in inventories, which would in all likelihood motivate buyers to step in, and sellers to cover. Despite short term rises in contract months, we think in order to see true stabilization in the price we will need to see not only demand pick up in the U.S. and Europe, but also crude storage globally have a significant down tick which will remain key.
Looking at June crude we can see support at $15.60, a break of this level may see increased sellers and thus a test of $15.10. These levels will have to hold for another leg higher in which case the first test of resistance will be at $16.25. If we can see the June contract break this with volume, along with crude data numbers to support this, the next test will be the $16.60 area. A test of these resistance areas on low contract volume and overbought RSI levels may see increased selling pressure, causing the contract to be range bound.
Crude Oil Jun '20 60 Min ChartSofts - Are Cocoa Prices Building Up for a Breakout
Are Cocoa Prices Building Up for a Breakout
By: Eric ScolesPosted 04/30/2020
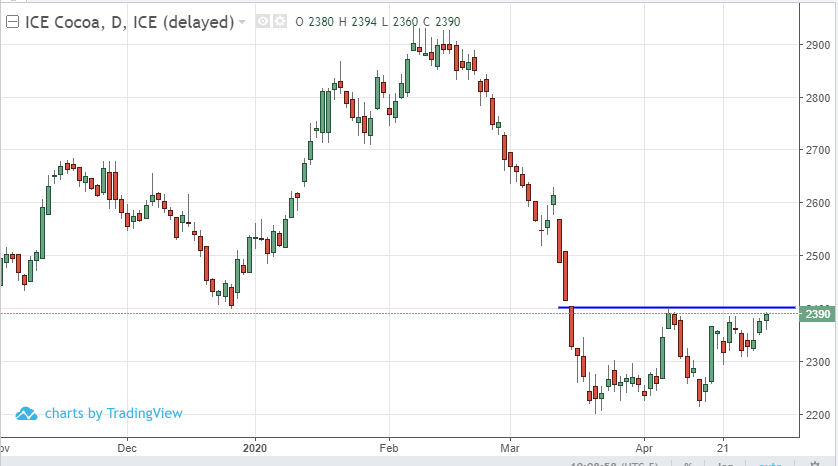
Jul ’20 Cocoa Futures start the day showing some strength despite weakness in equities this morning. Cocoa being economically sensitive has seen this product under price pressure with the constant threat lower demand holding buyers back. There has been some return of risk on sentiment building quietly in the markets which has been adding bullishness to this market. Rising or at least stable prices in Cocoa are supported by continued production concerns, which with any significant return in demand would give cocoa futures solid upside potential. From a technical perspective this market is well off the lows and has tested looks ready to test resistance again. If Jul ’20 cocoa futures can break out and close above 2400 it could be a solid bullish opportunity.
On
the heels of mid-Sep-to-early-Oct's steeper, accelerated, 3rd-wave-looking
recovery, the past week-and-a-half's boringly lateral chop is first considered
a corrective/consolidative event that warns of a continuation of the uptrend
that preceded it to new highs above 04-Oct's 891.0 high. This count
remains consistent with our broader base/correction/recovery count introduced
in 13-Sep's Technical Blog following that
day's bullish divergence in short-term momentum above 07-Sep's 809.5 minor
corrective high detailed in the hourly chart below.
The
important takeaway from this month's lateral, sleepy price action is the
definition of Wed's 851.5 low as
the end or lower boundary of a suspected 4th-Wave correction. A failure
below 851.5 will confirm a bearish divergence in daily momentum and defer or
threaten a bullish count enough to warrant non-bullish decisions like
long-covers. A failure below 851.5 will not
necessarily negate a broader bullish count, but it will threaten it enough to
warrant defensive measures as the next pertinent technical levels below 851.5 are
13-Sep's prospective minor 1st-Wave high at 813.8 and obviously 08-Sep's 766.0
low. And making non-bullish decisions "down there" is
sub-optimal to say the least. Per such, both short- and longer-term
commercial traders are advised to pare or neutralize bullish exposure on a
failure below 851.5, acknowledging and accepting whipsaw risk- back above 04-Oct's
891.0 high- in exchange for much deeper and sub-optimal nominal risk below
766.0.
On
a broader scale, the daily log scale chart above shows the developing potential
for a bearish divergence in daily momentum that will be considered confirmed
below 851.5. This chart also shows the past month's recovery thus far
stalling in the immediate neighborhood of the (888.0) Fibonacci
minimum 38.2% retrace of Apr-Sep's entire 1128 - 766 decline). COMBINED
with a failure below 851.5, traders
would then need to be concerned with at least a larger-degree correction pf the
past month's rally and possibly a resumption of Apr-Sep's major downtrend.
Until
and unless the market fails below 851.5 however, we would
remind longer-term players of the key elements on which our bullish count is
predicated:
a confirmed bullish divergence in WEEKLY momentum
(below)
amidst
an
historically low 11% reading in out RJO Bullish Sentiment Index and
a
textbook complete and major 5-wave Elliott sequence down from 29-Apr's
1128 high to 08-Sep's 766.0 low.
Thus
far, the market is only a month into correcting a 4-MONTH, 32% drawdown, so
further and possibly protracted gains remain well within the bounds of a major
(suspected 2nd-Wave) correction of Apr-Sep's decline within an even more
massive PEAK/reversal process from 17-May's 1219 high on an active continuation
basis below.
These
issues considered, a bullish policy and exposure remain advised with a failure
below 851.5 required to defer or threaten this call enough to warrant moving to
a neutral/sideline position. In lieu of such weakness, we anticipate a
continuation of the past month's rally to new highs and potentially significant
gains above 891.0.
Agricultural - Grain Futures Update w/Stephen Davis - 05/01/2020
Grain Futures Update w/Stephen Davis - 05/01/2020
By: Stephen DavisPosted 05/01/2020
Stephen Davis discusses the latest movements in the grain markets. Corn producers have started using corn to create grain alcohol for use in hand sanitizer.Agricultural - Positive Action In Cattle Market
Positive Action In Cattle Market
By: Peter McGinnPosted 05/01/2020
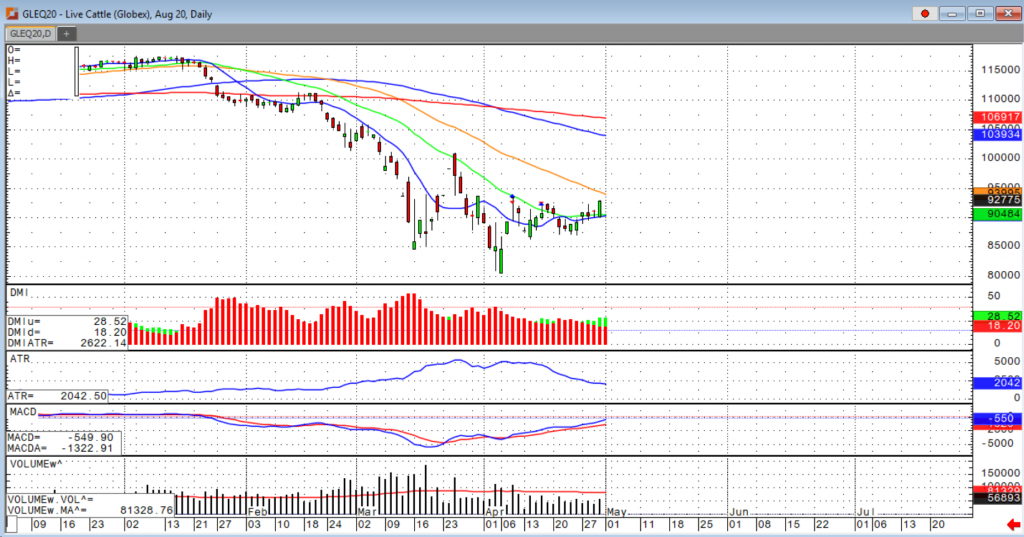
June cattle rallied at the close
yesterday giving some indication that there is some support in this market.
Cash prices traded at $95-$96, and the record high beef prices should benefit
the market in cleaning up the backlog of cattle. The talk of more and more
states slowly reopening has been a positive force in the market. The USDA boxed
beef cutout value was up $7.24 at mid-session yesterday and closed $10.18
higher at $367.56. This was up from $284.29 the previous week and was another
new all-time high. The cutout has increased $145.22 since April 9, a 65%
increase. The average dressed steer weight for the week ending April 18th came
in at 889 pounds, up from 886 the previous week and 857 a year ago. The 5-year
average weekly weight for that week is 862.4. The cattle markets have been very
volatile for the month of April but I think in May we will start to see an
upturn in the cattle markets.
U.S. beef export sales for the week ending April 23 totaled 9,388 tonnes, down from 11,217 the previous week and the lowest for any week since January 2. Total commitments for 2020 have reached 426,700 tonnes versus 396,400 a year ago and a five-year average of 349,300. This is also the highest total for this point in the year on record, which goes back as far as 2002. The biggest buyer this week was Japan at 2,856 tonnes, followed by South Korea at 1,186, Canada at 1,055, and China at 1,048. The countries with the largest commitments this year are Japan at 134,400 tonnes and South Korea at 108.800. China is in seventh place at 6,970. The USDA estimated cattle slaughter came in at 80,000 head yesterday. This brings the total for the week so far to 301,000 head, down from 339,000 last week and down from 485,000 a year ago.
Live Cattle Aug '20 Daily ChartCurrency - Euro Headed Higher Short-Term, but Lower Long-Term
Euro Headed Higher Short-Term, but Lower Long-Term
By: Steve SylasPosted 05/01/2020
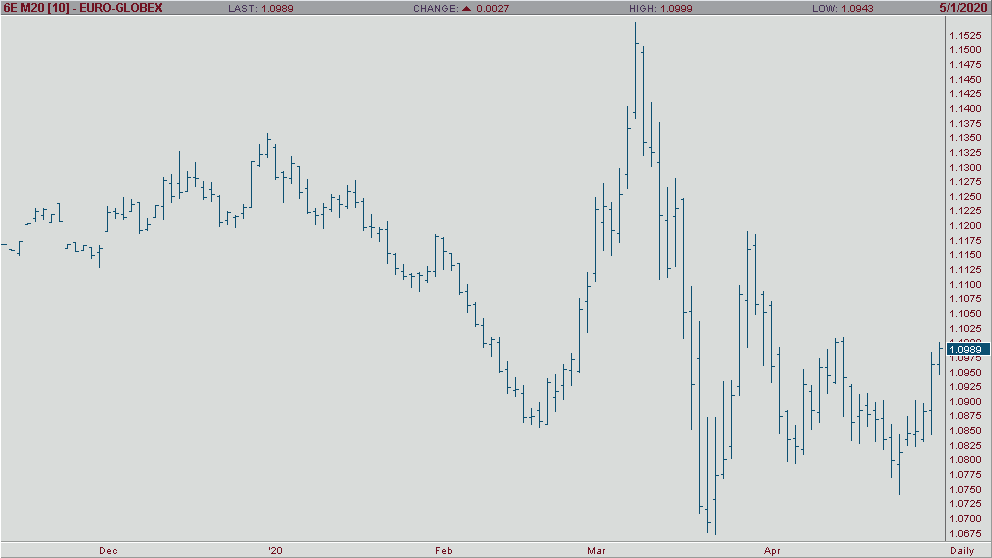
The Euro is likely to head higher for several reasons. First
and foremost, based on the technical side, there is a lot of buying strength on
the euro in the next few days. Prices are increasing at an exponential rate and
that is telltale of short-term upward strength. As far as long-term price
projections, the European economic forecasts are nothing short of bleak, even
by today’s standards. According to Focus Economics, the Eurozone’s economy is
projected to contract 4.1% in 2020, which is a downgrade of 5.1% from last
month’s forecast. If the forecast has already changed so much in such a short
period of time, who is to say that projections won’t get worse yet? Also, the
Eurozone had several economic challenges ahead even before the coronavirus
outbreak.
It has now been 3 years since the UK has requested a Brexit from the Eurozone, and without the powerful support of one of the world’s strongest economies, the Eurozone sustains a large loss from this. With the UK eventually exiting the Eurozone picture, EU parliament has called on the remaining 27 states to budget increases to support the EU’s smaller economies. Compared to the U.S. projecting excellent economic growth going into 2020 before the coronavirus outbreak, it seems EU economic growth is especially dismal news considering the Eurozone already went into 2020 with the mindset of straining economic growth before the outbreak. For these reasons, it seems apparent that the EU economy is likely to contract substantially more than fellow top currencies.
Euro Jun '20 Daily ChartEquity - Tariffs & Earnings & Trump, Oh My!
Tariffs & Earnings & Trump, Oh My!
By: Jeff Yasak, Senior Market StrategistPosted May 1, 2020 9:19AM CT
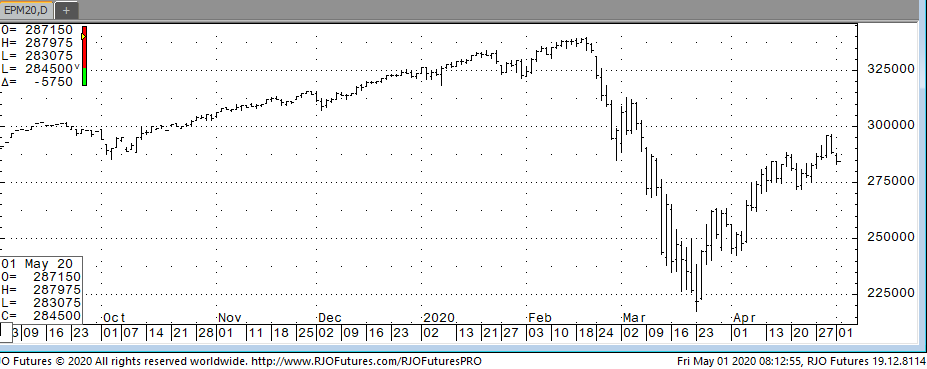
U.S. stock futures were trading lower this morning after corporate earnings were released after market Thursday and President Trump threatened China with more tariffs after the way they handled the coronavirus pandemic. The S&P 500 futures fell 2.1% after Apple released news that their earnings exceeded expectations, but their growth remained flat over last year’s basis. They also did not offer any estimate on June earnings with all the uncertainty created by the virus. This forced the stock to trade 2.6% lower in the premarket. Amazon also beat the estimates but warned that they will most likely lose money this quarter as spending is escalating to deal with the virus and the safety of its workers. It was this comment from CEO Jeff Bezos that helped fuel the 5.28% stock drop.” If you’re a shareholder in Amazon, you may want to take a seat, because we are not thinking small.”
Although the discussions are in the early stages, President trump suggested on Thursday that the trade deal with China is taking a backseat to the coronavirus and he is threatening new tariffs over the way Beijing handled the outbreak. These tariffs would have to be very strategic as he does not want to harm the current deal that is bringing personal protection equipment to the U.S.
Support is checking in today at 285500 and 282500 while resistance is 293600 and above at 299000.
If you have any questions or would like to discuss the markets further, please feel free to contact me at 888-861-1656 or jyasak@rjofutures.com. Economy - S-T Mo Failure Insufficient to End RBOB Correction, But Beware
S-T Mo Failure Insufficient to End RBOB Correction, But Beware
By: RJO Market InsightsPosted 11/08/2022
Posted on Nov 08, 2022, 07:51 by Dave Toth
In Fri's Technical Webcast we identified a
minor corrective low at 2.6328 from Thur as a mini risk parameter the market
needed to sustain gains above to maintain a more immediate bullish count.
The 240-min chart below shows the market's failure overnight below this level,
confirming a bearish divergence in very short-term momentum. This mo
failure defines Fri's 2.8172 high as
one of developing importance and a parameter from which very short-term traders
can objectively base non-bullish decisions like long-covers.
Given
the magnitude of the past three weeks' broader recovery however, this
short-term momentum failure is of an insufficient scale to conclude anything
more than another correction within this broader recovery from 26-Sep's 2.1877
low. Indeed, overnights failure below 2.6328 only allows us to conclude
the end of the portion of the month-and-a-half rally from 31-Oct's 2.4822 next
larger-degree corrective low. 2.4822 is the
risk parameter this market still needs to fail below to break the uptrend from
18-Oct's 2.3526 low while this 2.3526 low
remains intact as the risk parameter this market needs to fail below to break
the month-and-a-half uptrend. From an
intermediate-to-longer-term perspective, this week's setback falls well within
the bounds of another correction ahead of further gains. This is another
excellent example of the importance of technical and trading SCALE and
understanding and matching directional risk exposure to one's personal risk
profile.
The
reason overnight's admittedly minor mo failure might have longer-term
importance is the 2.8172-area from which it stemmed. In
Fri's Technical Blog we also noted the market's engagement of the
2.8076-to-2.8159-area marked by the 61.8% retrace of Jun0-Sewp's 3.2758 -2.1877
decline and the 1.000 progression of Sep-Oct's initial 2.1877 - 2.6185
(suspected a-Wave) rally from 18-Oct's 2.3526 (suspected b-Wave) low. We
remind longer-term players that because of the unique and compelling confluence
of:
early-Aug's bearish divergence in WEEKLY momentum
amidst
historically
extreme bullish sentiment/contrary opinion levels in our RJO Bullish
Sentiment Index
an
arguably complete and massive 5-wave Elliott sequence from Mar'20's 0.4605
low to Jun's 4.3260 high (as labeled in the weekly log active-continuation
chart below) and
the
5-wave impulsive sub-division of Jun-Sep's (suspected initial 1st-Wave) decline
The
recovery attempt from 26-Sep's 2.1877 low is arguably only a 3-wave (Wave-2)
corrective rebuttal to Jun-Sep's decline within a massive, multi-quarter
PEAK/reversal process. Now granted, due to the magnitude of 2020 -2022's
secular bull market, we discussed the prospect for this (2nd-Wave corrective)
recovery to be "extensive" in terms of both price and time. A
"more extensive" correction is typified by a retracement of 61.8% or
more and spanning weeks or even months following a 3-month decline. Per
such, the (suspected corrective) recovery from 26-Sep's 2.1877 low could easily
have further to go, with commensurately larger-degree weakness than that
exhibited this week (i.e., a failure below at least 2.4822) required
to consider the correction complete. Indeed, the daily log chart above
shows the market thus far respecting former 2.6185-area resistance from 10-Oct
as a new support candidate.
These
issues considered, very shorter-term traders have been advised to move to a neutral/sideline
position following overnight's momentum failure below 2.6328, with a recovery
above 2.8172 required to negate this call, reaffirm the recovery and re-expose
potentially significant gains thereafter. For intermediate- and
longer-term players, a bullish policy and exposure remain advised with a
failure below 2.4822 required to threaten this call enough to warrant
neutralizing exposure. We will be watchful for another bearish divergence
in momentum following a recovery attempt that falls short of Fri's 2.8172 high
that would be considered the next reinforcing factor to a count calling that
2.8172 high the prospective end to the month-and-a-half 2nd-Wave
correction. In lieu of such, a resumption of the current rally to
eventual new highs above 2.8172 should not surprise.