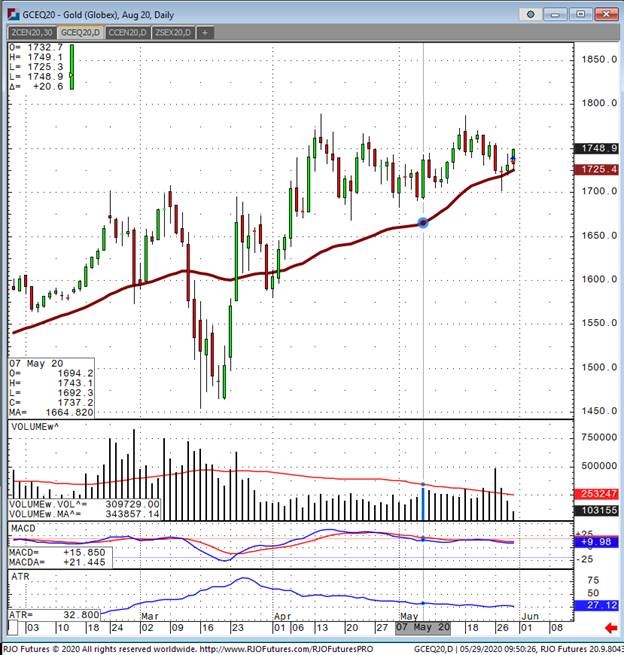
August gold has seen a sideways trend but giving investors and traders alike some excitement along the way. All of the noise out in the market regarding the precious metal has everyone paying attention, even if it’s a glance. Silver seems to be stealing the show as it’s trading more in a position of strength than its cousin gold. Having said that, this is about golds lackluster performance over the past several months, not silver’s recent strength. If we look at how gold is trading right now, it’s clear that a break above the recent highs is necessary for a bullish case to continue to be the picture investors are painting. I agree with many points I hear from tensions with China (even today with the Trump/Xi pressers) to the endless fed money printing. Great depression levels of unemployment and GDP that’s likely to take a while to recover.
To be clear, it’s a sideways trending market not a bull market. When August gold breaks above $1790, this is the sign to be bullish in my opinion. This is more about the technical to me than it is fundamentals. I could make a case for gold to be up or down, but technical will direct me to the latter unless something changes there. Gold has much strength this morning with equities sharply lower, and gold up $20 hovering around $1750. It may seem like a great time to buy but remember that this is not the first-time gold has seen this trade higher only to reverse and dip below $1700 before again recovering.
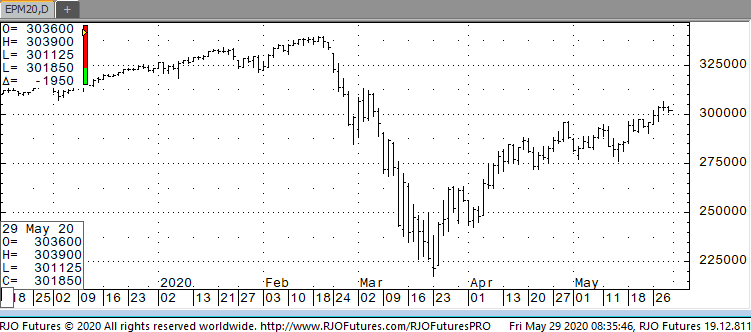
Gold Aug '20 Daily ChartMetals - Silver Riding The Economic Optimism
Silver Riding The Economic Optimism
By: Eli Tesfaye, Senior Market StrategistPosted May 29, 2020 9:28AM CT
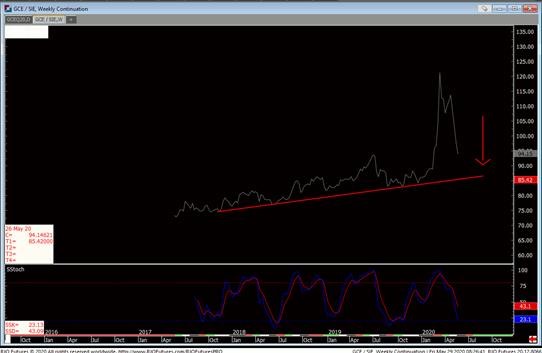
Front month July silver is up 40-cents on the day to 18.36 at the time of this writing. In my opinion, there are two main factors driving silver. One is the optimism on re-opening the economy, and the other is the tension between U.S. and China over Hong Kong. As you can see the chart below, silver is continuing to outperform gold on recovery bounce. Silver posted positive price action and is looking to close up for the week yet again. All this optimism is good. Silver still has to contend with deflationary type of fear down the road as the Fed is pushing rates into negative territory where they will probably stay for a while.
From technical prospective, the weekly chart in silver is looking to continue to make new highs. In my view,silver will see 20.00 dollar before it sees 15.00. In other words, the drive will likely have silver go higher before any major corrective price action.
Gold/Silver Ratio Daily Chart
If you have any questions or would like to discuss the markets further, please feel free to contact me at 800-367-7290 or etesfaye@rjofutures.com. Energy - OPEC+ Meeting Nearby
OPEC+ Meeting Nearby
By: Aleksandar CuricPosted 05/28/2020
Crude oil inventories rose by nearly 8.7 million barrels
along with along with gasoline and distillate stocks, according to API data.
EIA numbers will be watched for any unanticipated build ups. It should also be
noted that with crude trading above $30.00, U.S. producers should be at or past
break even now. Traders will be watching if this will motivate producers to
supply more to the market in the coming weeks, along with the early June OPEC+
meeting. The last joint production cut by the group was done in response to the
demand decimation caused by the pandemic, now that global cities have begun
re-opening it will be closely watched to see if they will continue down
the path of voluntary cuts. It should also be noted that although for the most
part API and EIA data may be priced in to the crude options market, the OPEC+
meeting is causing higher implied volatility in the June and July contracts.
This expansion is usually related to the underlying asset and uncertainty
related to the asset.
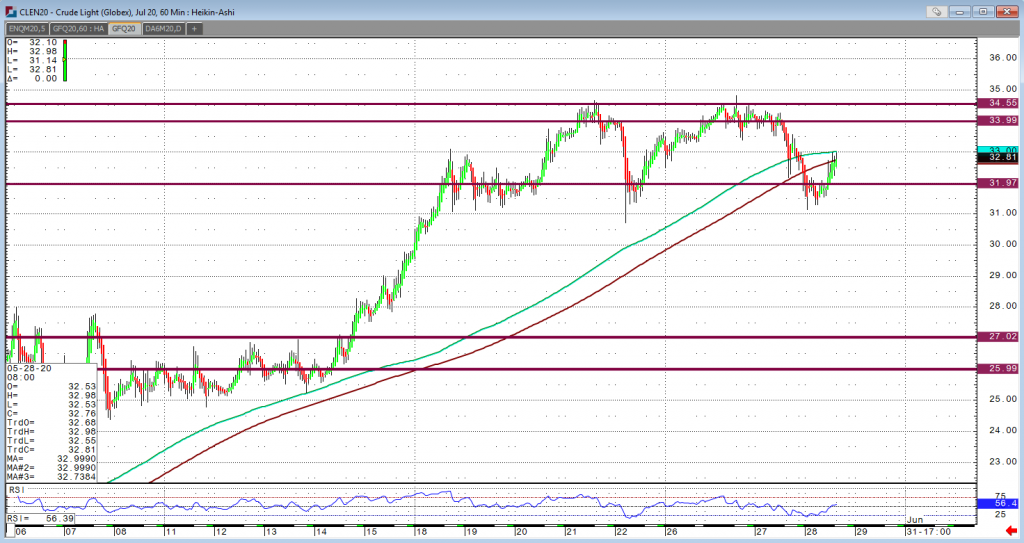
July crude had a short-term bearish signal as momentum indicators started trending lower, the contract has support at $32.50. This level will need to hold but if sellers step in we can see a move lower to test the $32.00 dollar level. Traders will need to watch the $33.00 dollar level as this resistance will need to be broke, in order to see a leg higher to the $34.00 level. These price objectives will serve as a benchmark while we wait for data from a fundamentals stand point to support price levels.
Crude Oil Jul '20 60 Min ChartSofts - A Bull Case Building in Cocoa
A Bull Case Building in Cocoa
By: Eric ScolesPosted 05/29/2020
July ’20 cocoa futures start the day under pressure but respecting 2400 as an area of support. Prices have been volatile with demand sentiment swinging back and forth in the near term as global economies seek confidence for successful reopening. Regularly flaring tensions between the U.S. and China continue weighing upon near term demand from both regions. Although, the phased lifting of social distancing restrictions in many parts of the U.S. is longer term bullish. Gains in the euro offer strong positive influence upon this market as well. Fundamentally demand should begin returning as lockdowns lift, people go back to work, and life begins returning to some sense of normal. Supply is under continued weather pressure with extended dry growing conditions which supports a big picture bullish case. Looking at the weekly charts Jul ’20 cocoa has been hovering about the 2400 level in consolidation, with 2403 appearing to be resistance from early march. My analysis suggests a clean break above the price area would signal on oncoming bull run in cocoa. Strong volatility is to be expected in the near-future until the trend becomes decided. Pull backs could become bullish opportunities, unless there is a major bearish shift in fundamentals.
On
the heels of mid-Sep-to-early-Oct's steeper, accelerated, 3rd-wave-looking
recovery, the past week-and-a-half's boringly lateral chop is first considered
a corrective/consolidative event that warns of a continuation of the uptrend
that preceded it to new highs above 04-Oct's 891.0 high. This count
remains consistent with our broader base/correction/recovery count introduced
in 13-Sep's Technical Blog following that
day's bullish divergence in short-term momentum above 07-Sep's 809.5 minor
corrective high detailed in the hourly chart below.
The
important takeaway from this month's lateral, sleepy price action is the
definition of Wed's 851.5 low as
the end or lower boundary of a suspected 4th-Wave correction. A failure
below 851.5 will confirm a bearish divergence in daily momentum and defer or
threaten a bullish count enough to warrant non-bullish decisions like
long-covers. A failure below 851.5 will not
necessarily negate a broader bullish count, but it will threaten it enough to
warrant defensive measures as the next pertinent technical levels below 851.5 are
13-Sep's prospective minor 1st-Wave high at 813.8 and obviously 08-Sep's 766.0
low. And making non-bullish decisions "down there" is
sub-optimal to say the least. Per such, both short- and longer-term
commercial traders are advised to pare or neutralize bullish exposure on a
failure below 851.5, acknowledging and accepting whipsaw risk- back above 04-Oct's
891.0 high- in exchange for much deeper and sub-optimal nominal risk below
766.0.
On
a broader scale, the daily log scale chart above shows the developing potential
for a bearish divergence in daily momentum that will be considered confirmed
below 851.5. This chart also shows the past month's recovery thus far
stalling in the immediate neighborhood of the (888.0) Fibonacci
minimum 38.2% retrace of Apr-Sep's entire 1128 - 766 decline). COMBINED
with a failure below 851.5, traders
would then need to be concerned with at least a larger-degree correction pf the
past month's rally and possibly a resumption of Apr-Sep's major downtrend.
Until
and unless the market fails below 851.5 however, we would
remind longer-term players of the key elements on which our bullish count is
predicated:
a confirmed bullish divergence in WEEKLY momentum
(below)
amidst
an
historically low 11% reading in out RJO Bullish Sentiment Index and
a
textbook complete and major 5-wave Elliott sequence down from 29-Apr's
1128 high to 08-Sep's 766.0 low.
Thus
far, the market is only a month into correcting a 4-MONTH, 32% drawdown, so
further and possibly protracted gains remain well within the bounds of a major
(suspected 2nd-Wave) correction of Apr-Sep's decline within an even more
massive PEAK/reversal process from 17-May's 1219 high on an active continuation
basis below.
These
issues considered, a bullish policy and exposure remain advised with a failure
below 851.5 required to defer or threaten this call enough to warrant moving to
a neutral/sideline position. In lieu of such weakness, we anticipate a
continuation of the past month's rally to new highs and potentially significant
gains above 891.0.
Agricultural - Grain Futures Update w/Stephen Davis - 05/29/2020
Grain Futures Update w/Stephen Davis - 05/29/2020
By: Stephen DavisPosted 05/29/2020
Steven Davis discusses the latest news coming out of the grain markets. With the U.S. economy slowly opening we could see things start to pick up shortly
Agricultural - Live Cattle Being Harvested Faster Than Expected
Live Cattle Being Harvested Faster Than Expected
By: Peter McGinnPosted 05/29/2020
June cattle finished higher on the day yesterday and closed at its highest level since March 6th. The short supply in the near-term market is helping to support a choppy cash trade with a range of $110-$120. Although last week’s Cattle on Feed report was bullish for the market in the near-term, traders are seeing weakness in the cash market in the coming months. The placement number from last week’s report, showing a 22% decrease from last year, may represent a good portion of the “disappearance” number. Calves were not put on feed, but instead have been put on other outside feeding programs like grass fed. Currently the supply is still tight but keeping track of the slaughter numbers is key going forward because cattle are being harvested at a much faster rate than expected. We could expect low numbers this week because of the holiday, but going into June and further into summer, expect those number to come back quickly.
The USDA estimated cattle slaughter came in at 110,000 head yesterday. This brings the total for the week so far to 220,000, down from 294,000 last week, and down from 248,000 a year ago. The USDA boxed beef cutout was down $5.92 at mid-session yesterday and closed $7.72 lower at $377.77. This was down from $409.47 the previous week and was the lowest the cutout had been since May 1. The cutout has fallen for ten straight sessions and has declined $97.62 or 21% off of its high from May 12.
Liv Cattle Jun '20 Daily ChartCurrency - Euro Propped to Take Off
Euro Propped to Take Off
By: Steve SylasPosted 05/29/2020
Euro prices are increasing at an exponential rate on the daily chart, signaling that it’s headed significantly higher, and there are several reasons to back this. The European Central Bank is soon to unroll an expansive stimulus package worth 750 billion euros. While this is seen to undoubtedly bolster the European economy, the fact that the stimulus package, compared to the United States’ several trillion dollar package and Japan’s trillion dollar package, it is far less expensive than other major countries’ packages, which will pay dividends into the near future as the Euro’s overall value will become stronger through less dilution. On top of this, the United States, the EU’s top trade partner amassing 615 billion euros in 2019, is beginning to open its economy once again, signaling increased trade between the two powerhouse economies. Between the EU’s expansive, but relatively modest stimulus package, increased economic activity, alongside a sound technical basis, euro futures seem highly likely to increase past 1.122.
Euro Fx Jun '20 Daily ChartEquity - Stocks Down, Await News on China
Stocks Down, Await News on China
By: Jeff Yasak, Senior Market StrategistPosted May 29, 2020 9:51AM CT
U.S. stock futures are down this morning as investors await
an address from President Trump on increased tensions between the U.S. and
China which some have characterized as “Cold War” status. Losses from Thursday
continued this morning, the final trading session of May, with the DJIA trading
over 100 pts lower. Today’s untimed address was announced after a joint
statement from the U.S., UK, Canada, and Australia condemned Beijing’s national
security laws on Hong Kong. The National People’s Congress, China’s parliament,
passed legislation that could greatly reduce democratic freedoms in that
semiautonomous city. All this follows Trump’s efforts to pass legislation
delisting some Chinese corporations from the U.S. exchanges. Also today, The
University of Michigan released its highly regarded consumer sentiment survey. This
index, a measurement of consumer attitudes on the business climate and
spending, rose to 72.3 up from 71.8 in April which is sharply down from the
100.0 level a year ago.
Support today is 252700 and 229500 with resistance showing 284500 and 293000.
E-mini S&P 500 Jun '20 Daily Chart If you have any questions or would like to discuss the markets further, please feel free to contact me at 888-861-1656 or jyasak@rjofutures.com. Economy - S-T Mo Failure Insufficient to End RBOB Correction, But Beware
S-T Mo Failure Insufficient to End RBOB Correction, But Beware
By: RJO Market InsightsPosted 11/08/2022
Posted on Nov 08, 2022, 07:51 by Dave Toth
In Fri's Technical Webcast we identified a
minor corrective low at 2.6328 from Thur as a mini risk parameter the market
needed to sustain gains above to maintain a more immediate bullish count.
The 240-min chart below shows the market's failure overnight below this level,
confirming a bearish divergence in very short-term momentum. This mo
failure defines Fri's 2.8172 high as
one of developing importance and a parameter from which very short-term traders
can objectively base non-bullish decisions like long-covers.
Given
the magnitude of the past three weeks' broader recovery however, this
short-term momentum failure is of an insufficient scale to conclude anything
more than another correction within this broader recovery from 26-Sep's 2.1877
low. Indeed, overnights failure below 2.6328 only allows us to conclude
the end of the portion of the month-and-a-half rally from 31-Oct's 2.4822 next
larger-degree corrective low. 2.4822 is the
risk parameter this market still needs to fail below to break the uptrend from
18-Oct's 2.3526 low while this 2.3526 low
remains intact as the risk parameter this market needs to fail below to break
the month-and-a-half uptrend. From an
intermediate-to-longer-term perspective, this week's setback falls well within
the bounds of another correction ahead of further gains. This is another
excellent example of the importance of technical and trading SCALE and
understanding and matching directional risk exposure to one's personal risk
profile.
The
reason overnight's admittedly minor mo failure might have longer-term
importance is the 2.8172-area from which it stemmed. In
Fri's Technical Blog we also noted the market's engagement of the
2.8076-to-2.8159-area marked by the 61.8% retrace of Jun0-Sewp's 3.2758 -2.1877
decline and the 1.000 progression of Sep-Oct's initial 2.1877 - 2.6185
(suspected a-Wave) rally from 18-Oct's 2.3526 (suspected b-Wave) low. We
remind longer-term players that because of the unique and compelling confluence
of:
early-Aug's bearish divergence in WEEKLY momentum
amidst
historically
extreme bullish sentiment/contrary opinion levels in our RJO Bullish
Sentiment Index
an
arguably complete and massive 5-wave Elliott sequence from Mar'20's 0.4605
low to Jun's 4.3260 high (as labeled in the weekly log active-continuation
chart below) and
the
5-wave impulsive sub-division of Jun-Sep's (suspected initial 1st-Wave) decline
The
recovery attempt from 26-Sep's 2.1877 low is arguably only a 3-wave (Wave-2)
corrective rebuttal to Jun-Sep's decline within a massive, multi-quarter
PEAK/reversal process. Now granted, due to the magnitude of 2020 -2022's
secular bull market, we discussed the prospect for this (2nd-Wave corrective)
recovery to be "extensive" in terms of both price and time. A
"more extensive" correction is typified by a retracement of 61.8% or
more and spanning weeks or even months following a 3-month decline. Per
such, the (suspected corrective) recovery from 26-Sep's 2.1877 low could easily
have further to go, with commensurately larger-degree weakness than that
exhibited this week (i.e., a failure below at least 2.4822) required
to consider the correction complete. Indeed, the daily log chart above
shows the market thus far respecting former 2.6185-area resistance from 10-Oct
as a new support candidate.
These
issues considered, very shorter-term traders have been advised to move to a neutral/sideline
position following overnight's momentum failure below 2.6328, with a recovery
above 2.8172 required to negate this call, reaffirm the recovery and re-expose
potentially significant gains thereafter. For intermediate- and
longer-term players, a bullish policy and exposure remain advised with a
failure below 2.4822 required to threaten this call enough to warrant
neutralizing exposure. We will be watchful for another bearish divergence
in momentum following a recovery attempt that falls short of Fri's 2.8172 high
that would be considered the next reinforcing factor to a count calling that
2.8172 high the prospective end to the month-and-a-half 2nd-Wave
correction. In lieu of such, a resumption of the current rally to
eventual new highs above 2.8172 should not surprise.