Historically, the E-mini S&P 500 is one of the most popular and widely traded futures contracts around the world. The reason behind its popularity lies within the leverage it affords the trader, and when you couple that with its accessibility and ease to trade it makes the contract viable to virtually any trader. The S&P 500 hits new highs seemingly every day and now is the perfect time to add it to your portfolio. Complete with actionable trading strategies our E-mini S&P 500 Investor kit is here to help all traders, regardless of experience!
The Markets
Metals - Gold Needs a Push Above $1880
Gold Needs a Push Above $1880
By: Joshua GravesPosted 01/29/2021
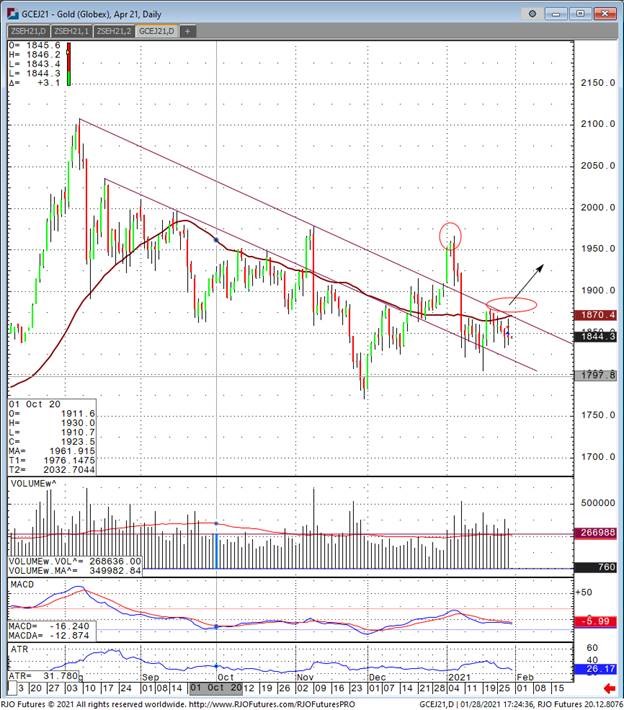
April gold futures has had its fair share of dramatic swings over the past few months. Just when traders thought it was breaking out above 1950 on the way to a 2 handle, the market sold off $140 in 4 sessions. Now it appears gold is ripe for another push higher as an inverted head and shoulder pattern forms and a break above 1880 would signal a break in the channel lower it’s been in. Now, this isn’t the sign to go all in by any means, but it is a sign that 1950 and then the actual high point of 1966 is the next upside target as it’s a multi month high. In my opinion the only way to trade gold is from a position standpoint and hold over the course of several weeks or try and day trade it as the volatility seems to be enough to make money. Silver is stealing the show right now and gold doesn’t have the same industrial and safe haven hybrid use that gold does. I would be positioning long gold from these levels with sell stops beneath the recent spike low of 1804.70. A close or a violation of this level is a signal to anyone shorting gold to step on the gas and a retest of the multi month low tick of 1771 is coming. I’ve heard all of the fundamentals on gold and silver, but technical aspects are more important to watch at this point, and it appears that unless a push above the levels mentioned above happen soon, look out below.
Energy - Oil Prices Holding Steady
Oil Prices Holding Steady
By: Alex Turro, Senior Market StrategistPosted Jan 29, 2021 9:47AM CT
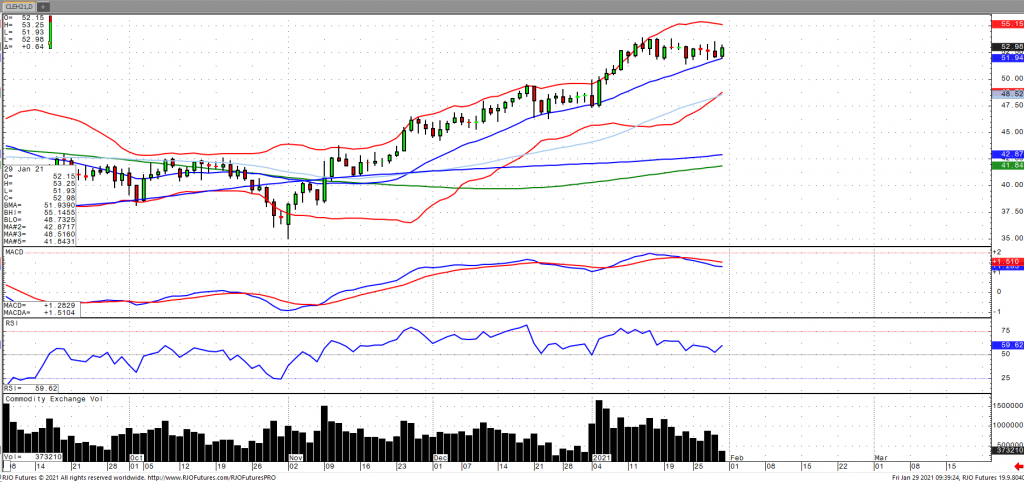
Oil prices are edging higher early Friday as the market assess the ongoing changes in supply and demand fundamentals. Saudi Arabia is expected to extend output cuts by 1 million barrels per day in February and March with OPEC+ supply cuts set to rise to 8.125 million bpd in February. US oil inventories posted a significant decline of 9.9 million barrels, according to the EIA. In addition, Chinese refinery run rates increased this week with Indian demand expected to return to pre – virus levels this upcoming quarter. This helped to largely offset concerns regarding the ongoing recovery in fuel demand amid stalling vaccine rollouts and new virus strains. The market remains bullish trend with today’s range seen between 52.00 – 53.73.
Oil Mar '21 Daily Chart If you have any questions or would like to discuss the markets further, please feel free to contact me at 800-438-4805 or aturro@rjofutures.com. Softs - Support in Prices for Cocoa Futures
Support in Prices for Cocoa Futures
By: Peter MoosesPosted 01/29/2021
Although
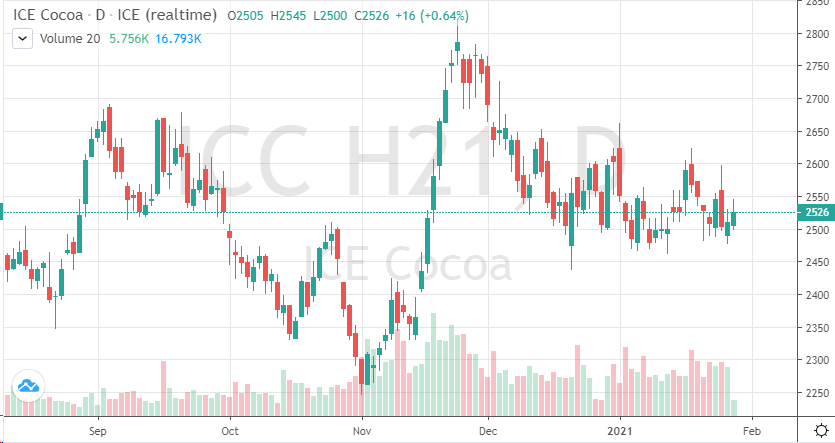
the current cocoa chart is a bit confusing, it has been in a wide rangebound
trade since the start of 2021. That being said - look for March cocoa to trade
between 2500-2600 in the short-term. Chocolate companies reported weaker
earning in 2020 due to the pandemic, but if the vaccines can help individuals
get back to a new normal, 2021 should see an increase in revenue. The macro-sentiment
of late has been slowly moving in a positive direction as more is learned about
the vaccination process. More reopening, less lockdowns will be supportive for
the “foods” prices in commodities.
The currency markets and equity markets are also providing support to cocoa prices. Weather premium in key growing regions must be accounted for too. West Africa is experiencing their dry season and it appears that it may be even hotter than previous years in the coming days. That being said, heat could potentially hurt production numbers but boost prices. Grinding data for the coming year is expected to be fairly in-line with last. If we see consistent levels, prices will hold or move higher on any data that comes in more positive. For now, traders need to be patient and see how the first quarter plays out on the macro side of commodities.
On
the heels of mid-Sep-to-early-Oct's steeper, accelerated, 3rd-wave-looking
recovery, the past week-and-a-half's boringly lateral chop is first considered
a corrective/consolidative event that warns of a continuation of the uptrend
that preceded it to new highs above 04-Oct's 891.0 high. This count
remains consistent with our broader base/correction/recovery count introduced
in 13-Sep's Technical Blog following that
day's bullish divergence in short-term momentum above 07-Sep's 809.5 minor
corrective high detailed in the hourly chart below.
The
important takeaway from this month's lateral, sleepy price action is the
definition of Wed's 851.5 low as
the end or lower boundary of a suspected 4th-Wave correction. A failure
below 851.5 will confirm a bearish divergence in daily momentum and defer or
threaten a bullish count enough to warrant non-bullish decisions like
long-covers. A failure below 851.5 will not
necessarily negate a broader bullish count, but it will threaten it enough to
warrant defensive measures as the next pertinent technical levels below 851.5 are
13-Sep's prospective minor 1st-Wave high at 813.8 and obviously 08-Sep's 766.0
low. And making non-bullish decisions "down there" is
sub-optimal to say the least. Per such, both short- and longer-term
commercial traders are advised to pare or neutralize bullish exposure on a
failure below 851.5, acknowledging and accepting whipsaw risk- back above 04-Oct's
891.0 high- in exchange for much deeper and sub-optimal nominal risk below
766.0.
On
a broader scale, the daily log scale chart above shows the developing potential
for a bearish divergence in daily momentum that will be considered confirmed
below 851.5. This chart also shows the past month's recovery thus far
stalling in the immediate neighborhood of the (888.0) Fibonacci
minimum 38.2% retrace of Apr-Sep's entire 1128 - 766 decline). COMBINED
with a failure below 851.5, traders
would then need to be concerned with at least a larger-degree correction pf the
past month's rally and possibly a resumption of Apr-Sep's major downtrend.
Until
and unless the market fails below 851.5 however, we would
remind longer-term players of the key elements on which our bullish count is
predicated:
a confirmed bullish divergence in WEEKLY momentum
(below)
amidst
an
historically low 11% reading in out RJO Bullish Sentiment Index and
a
textbook complete and major 5-wave Elliott sequence down from 29-Apr's
1128 high to 08-Sep's 766.0 low.
Thus
far, the market is only a month into correcting a 4-MONTH, 32% drawdown, so
further and possibly protracted gains remain well within the bounds of a major
(suspected 2nd-Wave) correction of Apr-Sep's decline within an even more
massive PEAK/reversal process from 17-May's 1219 high on an active continuation
basis below.
These
issues considered, a bullish policy and exposure remain advised with a failure
below 851.5 required to defer or threaten this call enough to warrant moving to
a neutral/sideline position. In lieu of such weakness, we anticipate a
continuation of the past month's rally to new highs and potentially significant
gains above 891.0.
Agricultural - Grain Futures Update w/Stephen Davis - 01/29/2021
Grain Futures Update w/Stephen Davis - 01/29/2021
By: Stephen DavisPosted 01/29/2021
Stephen Davis discusses the latest news in the grain markets. China still has to buy US grains as part of the Phase One Trade Deal and it will be interesting to see how it will impact the markets.Agricultural - Strength in Lean Hogs Continues
Strength in Lean Hogs Continues
By: Peter McGinnPosted 01/29/2021
The hog market is showing signs of strength and looks to
continue higher as we are now moving into February. Cash hogs are expected to
move higher due to the packer interest in keeping the processing speeds going
at an accelerated rate. The 1/26 CME Lean Hog Index was up another $.72 to
$66.95. The National Pork Carcass Cutout value was up $2.38 to $83.49 on
average movement of 338 loads. Estimated packer margins were $45.75/head
for non-integrators and $41.81/head for integrators vs. $42.18 and $37.02 the
previous day. The weekly Export Sales data showed 52,855mt of pork booked on
the week ending 1/21. That was the largest since October and was just the 6th
weekly sale above 50,000mt since 2020 began. Weekly kill is down
2.83% vs. last year. USDA’s National Average Base Hog price was quoted at
$57.01, up by $.26. Pork cutout futures closed with gains of $.20-$.40, save
for a $0.97 drop in Feb.
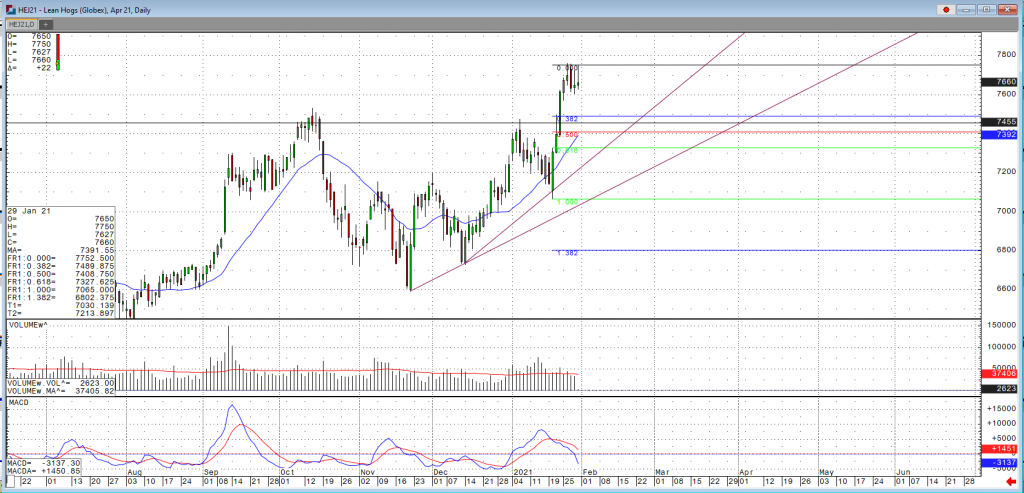
The futures are rolling over and we are starting to see weights decrease steadily from the beginning of the year. Demand is very strong right now with the December cold storage report showing belly stocks well below last year’s number. Analysts think the April futures are in overbought territory with such a high premium to the cash market. The large supply of pork is being met with soaring demand and is helping to support the market, continued talk of African Swine Fever in China is one of the major reasons we are seeing these strong export numbers. April futures finished at $76.37 yesterday, I would be looking to stay long unless we see a close under $74.50.
Lean Hogs Apr '21 Daily ChartEquity - Stocks Down This Morning
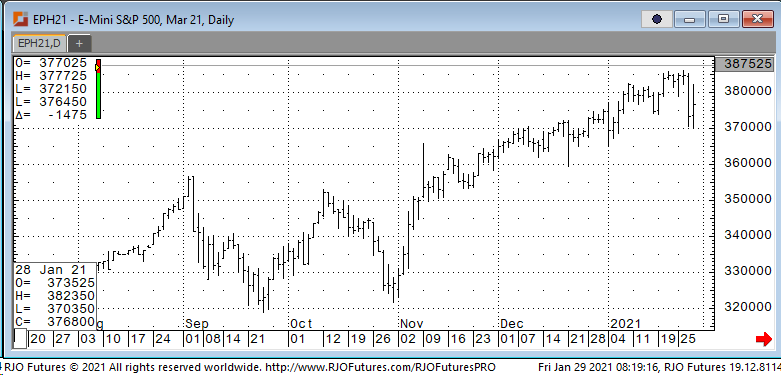
Stocks Down This Morning
By: Jeff Yasak, Senior Market StrategistPosted Jan 29, 2021 9:14AM CT
U.S. stock futures
were down this morning after some negative news from Johnson & Johnson on
the effectiveness of its one-shot vaccine to fight coronavirus. Also, large amounts of speculative trading
from the retail sector is also causing concern across the markets with the
volatility it is creating. JNJ released
data this morning that their one-shot vaccine option was only showing a 66%
effective rate compared to Pfizer and Moderna’s 95% effective rate for their two-shot
dose. Robinhood removed some buying restrictions on stocks they had halted
yesterday with the “short-squeeze” trades we have seen this week. This caused GameStop shares to double in
premarket trading today after $1billion was received from said investors
overnight. The thought of a continuing
rise in these sorts of stocks is causing concern that it will carry over to
more industries as funds will have to sell other holdings to raise cash for
short positions held. It will be very interesting
to see how this day unfolds.
Resistance is 384500 and 389200 with support showing 372500 and 365000.
E-mini S&P 500 Mar '21 Daily Chart If you have any questions or would like to discuss the markets further, please feel free to contact me at 888-861-1656 or jyasak@rjofutures.com. Economy - S-T Mo Failure Insufficient to End RBOB Correction, But Beware
S-T Mo Failure Insufficient to End RBOB Correction, But Beware
By: RJO Market InsightsPosted 11/08/2022
Posted on Nov 08, 2022, 07:51 by Dave Toth
In Fri's Technical Webcast we identified a
minor corrective low at 2.6328 from Thur as a mini risk parameter the market
needed to sustain gains above to maintain a more immediate bullish count.
The 240-min chart below shows the market's failure overnight below this level,
confirming a bearish divergence in very short-term momentum. This mo
failure defines Fri's 2.8172 high as
one of developing importance and a parameter from which very short-term traders
can objectively base non-bullish decisions like long-covers.
Given
the magnitude of the past three weeks' broader recovery however, this
short-term momentum failure is of an insufficient scale to conclude anything
more than another correction within this broader recovery from 26-Sep's 2.1877
low. Indeed, overnights failure below 2.6328 only allows us to conclude
the end of the portion of the month-and-a-half rally from 31-Oct's 2.4822 next
larger-degree corrective low. 2.4822 is the
risk parameter this market still needs to fail below to break the uptrend from
18-Oct's 2.3526 low while this 2.3526 low
remains intact as the risk parameter this market needs to fail below to break
the month-and-a-half uptrend. From an
intermediate-to-longer-term perspective, this week's setback falls well within
the bounds of another correction ahead of further gains. This is another
excellent example of the importance of technical and trading SCALE and
understanding and matching directional risk exposure to one's personal risk
profile.
The
reason overnight's admittedly minor mo failure might have longer-term
importance is the 2.8172-area from which it stemmed. In
Fri's Technical Blog we also noted the market's engagement of the
2.8076-to-2.8159-area marked by the 61.8% retrace of Jun0-Sewp's 3.2758 -2.1877
decline and the 1.000 progression of Sep-Oct's initial 2.1877 - 2.6185
(suspected a-Wave) rally from 18-Oct's 2.3526 (suspected b-Wave) low. We
remind longer-term players that because of the unique and compelling confluence
of:
early-Aug's bearish divergence in WEEKLY momentum
amidst
historically
extreme bullish sentiment/contrary opinion levels in our RJO Bullish
Sentiment Index
an
arguably complete and massive 5-wave Elliott sequence from Mar'20's 0.4605
low to Jun's 4.3260 high (as labeled in the weekly log active-continuation
chart below) and
the
5-wave impulsive sub-division of Jun-Sep's (suspected initial 1st-Wave) decline
The
recovery attempt from 26-Sep's 2.1877 low is arguably only a 3-wave (Wave-2)
corrective rebuttal to Jun-Sep's decline within a massive, multi-quarter
PEAK/reversal process. Now granted, due to the magnitude of 2020 -2022's
secular bull market, we discussed the prospect for this (2nd-Wave corrective)
recovery to be "extensive" in terms of both price and time. A
"more extensive" correction is typified by a retracement of 61.8% or
more and spanning weeks or even months following a 3-month decline. Per
such, the (suspected corrective) recovery from 26-Sep's 2.1877 low could easily
have further to go, with commensurately larger-degree weakness than that
exhibited this week (i.e., a failure below at least 2.4822) required
to consider the correction complete. Indeed, the daily log chart above
shows the market thus far respecting former 2.6185-area resistance from 10-Oct
as a new support candidate.
These
issues considered, very shorter-term traders have been advised to move to a neutral/sideline
position following overnight's momentum failure below 2.6328, with a recovery
above 2.8172 required to negate this call, reaffirm the recovery and re-expose
potentially significant gains thereafter. For intermediate- and
longer-term players, a bullish policy and exposure remain advised with a
failure below 2.4822 required to threaten this call enough to warrant
neutralizing exposure. We will be watchful for another bearish divergence
in momentum following a recovery attempt that falls short of Fri's 2.8172 high
that would be considered the next reinforcing factor to a count calling that
2.8172 high the prospective end to the month-and-a-half 2nd-Wave
correction. In lieu of such, a resumption of the current rally to
eventual new highs above 2.8172 should not surprise.