RJO FuturesCast

February 21, 2020 | Volume 14, Issue 8

The Markets

Metals - April Gold is Full Steam Ahead

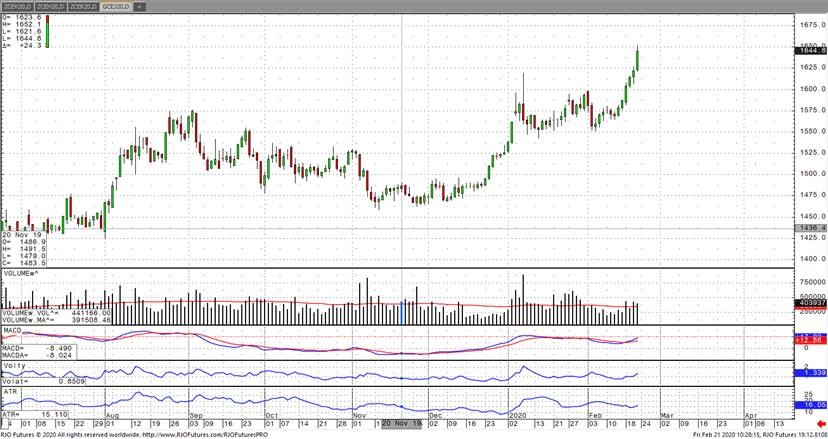
April gold futures have exploded well beyond the spike high we had back in early January with an acceleration of the coronavirus outbreak and news that it is continuing to spread. Traders should be cautious right now with the gold market now in territory we have not seen in 7+ years. This is the time to look at opportunities to utilize options now that volatility premium has increased and possibly trading the shorter term (30 days or less) options. The overall theme supporting gold that is central bank buying and countries such as Russia and China diversifying away from the strong U.S. dollar and buying substantial amounts of physical gold has not gone away. This has been propping up the market along with traders around the world taking note that the stock market seems to be shrugging off the virus and its longer-term impact on company earnings. Today, we see the US equities selling off and gold making an exploding move higher trading as high as $1652 as I write this.

When any market starts making moves like this it captivates people’s attention and the “FOMO” on the trade. Gold is likely to continue its move higher, but only briefly. What could derail this rally is any information that indicates the virus is under control and vaccines are now widely available. Right now, the vast majority of cases are in China, but the impact on the markets longer term is very unknown. I think the Chinese are likely to underreport the economic damage as they’ve done in the past and continue to inject stimulus money (over $400B so far) to keep their economy humming along. Gold is worth taking a shot at regardless, and if you would like to know how best to play the precious metal please contact me directly.

Metals - Palladium Price Indicated Global Warming

Have you looked at Palladium prices lately? well few months ago I wrote about it in insidefutures.com and described how price was heading to 2000. Well, here is my new prediction for palladium—it’s going over 3000

Below you see a chart of palladium/gold ratio sitting around 1.571. As you can see, palladium is the hottest and fastest performing metal as it is charging past gold.  In fact, it is even pulling platinum with it.

As I have stated before, many factors are contributing to this parabolic rally in Palladium, this didn’t happen overnight. I am amazed it took this long to explode. More countries are finally waking up to the fact that it is in their best interest to upgrade their emissions requirements. I think the public will continue to learn more about this metal in great detail as awareness continues to grow. I have sporadically written about it in the past, but palladium is becoming an advocate for clean air AND clear indication of global warming. If you don’t believe climate change is real, take a look at the chart below, it may change your mind.

Gold/Palladium Ratio Daily Chart
If you have any questions or would like to discuss the markets further, please feel free to contact me at 800-367-7290 or etesfaye@rjofutures.com.
Energy - Oil Falls on Renewed Virus Concerns

Oil prices fell nearly 2% early Friday amidst an increase in new coronavirus cases as well weakening Asian economic data which softened economic outlook and demand prospects. The upward reversal from yesterday’s high comes among a weekly decline in inventories, with US imports falling and exports increasing. Russian Energy Minister Novak noted on Thursday he does not see a reason to meet prior to the upcoming gathering in early March with expectations of an extension or deepening of the curbs. In addition, cease talks between forces fighting outside Libya’s capital have continued with an agreement potentially ending outages of about 1 million barrels per day, which would only serve to increase pressure on prices.  The market remains bearish trend with today’s range seen between 48.63-54.31.

Crude Oil Apr '20 Daily Chart
If you have any questions or would like to discuss the markets further, please feel free to contact me at 800-438-4805 or aturro@rjofutures.com.
Softs - Cocoa Charts Look Bullish

Cocoa futures have been a little choppy but overall a solid bullish market. We’ve seen prices moving in a downward channel since the highs on February 7th highs but when pulling back to look at a bigger picture it appears to be nothing more than a bull flag. For the most part this market is supported by strong fundamentals with supply concerns related to weather induced production issues; but is subject to volatility on fluctuating demand concerns especially out of Asia. If we can see some sustained positive prospects that Chinese efforts to control the virus and support its economy is effective, we can reasonably expect to see cocoa prices climb up past 2900 and beyond.

Cocoa Mar '20 Daily Chart
Agricultural - Bullish Canola Count Intact Above Minimum 851.5

Posted on Oct 14, 2022, 07:42 by Dave Toth

On the heels of mid-Sep-to-early-Oct's steeper, accelerated, 3rd-wave-looking recovery, the past week-and-a-half's boringly lateral chop is first considered a corrective/consolidative event that warns of a continuation of the uptrend that preceded it to new highs above 04-Oct's 891.0 high.  This count remains consistent with our broader base/correction/recovery count introduced in 13-Sep's Technical Blog following that day's bullish divergence in short-term momentum above 07-Sep's 809.5 minor corrective high detailed in the hourly chart below.

The important takeaway from this month's lateral, sleepy price action is the definition of Wed's 851.5 low as the end or lower boundary of a suspected 4th-Wave correction.  A failure below 851.5 will confirm a bearish divergence in daily momentum and defer or threaten a bullish count enough to warrant non-bullish decisions like long-covers.  A failure below 851.5 will not necessarily negate a broader bullish count, but it will threaten it enough to warrant defensive measures as the next pertinent technical levels below 851.5 are 13-Sep's prospective minor 1st-Wave high at 813.8 and obviously 08-Sep's 766.0 low.  And making non-bullish decisions "down there" is sub-optimal to say the least.  Per such, both short- and longer-term commercial traders are advised to pare or neutralize bullish exposure on a failure below 851.5, acknowledging and accepting whipsaw risk- back above 04-Oct's 891.0 high- in exchange for much deeper and sub-optimal nominal risk below 766.0.

On a broader scale, the daily log scale chart above shows the developing potential for a bearish divergence in daily momentum that will be considered confirmed below 851.5.  This chart also shows the past month's recovery thus far stalling in the immediate neighborhood of the (888.0) Fibonacci minimum 38.2% retrace of Apr-Sep's entire 1128 - 766 decline).  COMBINED with a failure below 851.5, traders would then need to be concerned with at least a larger-degree correction pf the past month's rally and possibly a resumption of Apr-Sep's major downtrend.

Until and unless the market fails below 851.5 however, we would remind longer-term players of the key elements on which our bullish count is predicated:

  • a confirmed bullish divergence in WEEKLY momentum (below) amidst
  • an historically low 11% reading in out RJO Bullish Sentiment Index and
  • a textbook complete and major 5-wave Elliott sequence down from 29-Apr's 1128 high to 08-Sep's 766.0 low.

Thus far, the market is only a month into correcting a 4-MONTH, 32% drawdown, so further and possibly protracted gains remain well within the bounds of a major (suspected 2nd-Wave) correction of Apr-Sep's decline within an even more massive PEAK/reversal process from 17-May's 1219 high on an active continuation basis below.

These issues considered, a bullish policy and exposure remain advised with a failure below 851.5 required to defer or threaten this call enough to warrant moving to a neutral/sideline position.  In lieu of such weakness, we anticipate a continuation of the past month's rally to new highs and potentially significant gains above 891.0.

Agricultural - Grain Futures Update w/Stephen Davis - 02/21/2020

Stephen Davis discusses this week's movements in the grain markets. With war on coronavirus still waging on, the impacts are still being felt on the grains around the world, specifically in China.

Agricultural - Cattle Prices Down Amid Record Production

There is plenty of beef in the short-term, but we may see a technical recovery. We would need to see some higher prices in cash cattle to support this uptrend. Right now, we’re looking at the highest beef production for this year since 2008, demand on the other had looks to sluggish causing a limited upside forecast. China did come out and say they are going to cut tariffs on some agriculture products which includes beef, but since they are not an aggressive buyer of beef, traders are reluctant to buy the market on this kind of news alone. The USDA boxed beef cutout was down 86-cents at mid-session yesterday and closed $1.13 lower at $206.13. This was down from $207.83 the previous week and was the lowest the cutout had been since October 17, 2018.

Cash live cattle were quiet on Monday and Tuesday, except for 18 loads that traded in Iowa/Minnesota at 119. The 5-area weighted average steer price last week was 118.90, down from 121.05 the previous week and 124.96 a year ago. The USDA estimated cattle slaughter came in at 123,000 head yesterday. This brings the total for the week so far to 230,000 head, down from 241,000 last week, but up from 215,000 a year ago. For the USDA Cattle-on-feed report for Friday, traders see placements of cattle into feedlots coming in at 1.5% above a year ago (range of down 2.2% to up 3.5%). Marketing's for the month of January are expected to be up 0.7% in a range of down 2.4% to up 1.6%. This would leave feedlot supply at as of February 1 at 2.4% above last year. The range is up 1.8% to up 3%.

Live Cattle Apr '20 Daily Chart
Currency - U.S. Dollar Reversal

The U.S. dollar index is under strong selling pressure Friday morning, trading 60 points below Thursday’s three-year high. After the parabolic run higher since the turn of the year, it is not surprising to see the market take a breath after this morning’s PMI number missed expectations, coming in at 48.6 vs 52.5 consensus. Depressed foreign currency futures are making a run higher in response to the dollar trade. Notable leaders are the European currencies, with the euro, the pound, and the Swiss trading 0.63% higher after better than expected PMI readings from both Britain and the EU. The technical action is indicative of reversals if these moves hold into the close. First support was broken in dollar index, which projects trade down to the 98.69 area. The prospect for additional rate cuts this year is pressuring the greenback, with odds of a cut at the April meeting now at 33% according to the CME. Should stocks see downside follow-through, talk of rate cuts will be more prominent and USD bears will roar more loudly. The Japanese yen is the weakest of the currency futures after Japan reported a Q4 GDP contraction of 6.3% this week.

USD Mar '20 Daily Chart

Equity - Stock Market Down as Coronavirus Cases Spike

U.S. stock futures are trading lower this morning on continued fears of a global economic decline from the coronavirusDow Jones Industrial Average futures are trading lower, with a loss of 95 points at the open. S&P 500 and Nasdaq 100 futures are also primed to lower open. The number of confirmed cases in China increased with over 800 new cases announced overnight. South Korea and Japan also announced new cases.

“It could be some larger players hedging against downside risk of the coronavirus spreading,” said Chris Zaccarelli, chief investment officer at Independent Advisor Alliance. “That, on top of the Goldman call that a correction is more likely, has people on edge.”

Other economic events coming up include.

  • Earnings season rolls on, with results from Deere & Co. set for Friday.
  • Euro-area PMI and inflation data are also due Friday.
  • Group of 20 finance ministers and central bank chiefs are due to meet Feb. 22-23 in Riyadh, Saudi Arabia, and are expected to discuss efforts to support growth amid the coronavirus threat

Resistance today is 339900 and342600 with support at 334000 and 331000

E-mini S&P 500 Mar '20 Daily Chart
If you have any questions or would like to discuss the markets further, please feel free to contact me at 888-861-1656 or jyasak@rjofutures.com.
Economy - S-T Mo Failure Insufficient to End RBOB Correction, But Beware

Posted on Nov 08, 2022, 07:51 by Dave Toth

In Fri's Technical Webcast we identified a minor corrective low at 2.6328 from Thur as a mini risk parameter the market needed to sustain gains above to maintain a more immediate bullish count.  The 240-min chart below shows the market's failure overnight below this level, confirming a bearish divergence in very short-term momentum.  This mo failure defines Fri's 2.8172 high as one of developing importance and a parameter from which very short-term traders can objectively base non-bullish decisions like long-covers.

Given the magnitude of the past three weeks' broader recovery however, this short-term momentum failure is of an insufficient scale to conclude anything more than another correction within this broader recovery from 26-Sep's 2.1877 low.  Indeed, overnights failure below 2.6328 only allows us to conclude the end of the portion of the month-and-a-half rally from 31-Oct's 2.4822 next larger-degree corrective low.  2.4822 is the risk parameter this market still needs to fail below to break the uptrend from 18-Oct's 2.3526 low while this 2.3526 low remains intact as the risk parameter this market needs to fail below to break the month-and-a-half uptrend.  From an intermediate-to-longer-term perspective, this week's setback falls well within the bounds of another correction ahead of further gains.  This is another excellent example of the importance of technical and trading SCALE and understanding and matching directional risk exposure to one's personal risk profile.

The reason overnight's admittedly minor mo failure might have longer-term importance is the 2.8172-area from which it stemmed.  In Fri's Technical Blog we also noted the market's engagement of the 2.8076-to-2.8159-area marked by the 61.8% retrace of Jun0-Sewp's 3.2758 -2.1877 decline and the 1.000 progression of Sep-Oct's initial 2.1877 - 2.6185 (suspected a-Wave) rally from 18-Oct's 2.3526 (suspected b-Wave) low.  We remind longer-term players that because of the unique and compelling confluence of:

  • early-Aug's bearish divergence in WEEKLY momentum amidst
  • historically extreme bullish sentiment/contrary opinion levels in our RJO Bullish Sentiment Index
  • an arguably complete and massive 5-wave Elliott sequence from Mar'20's 0.4605 low to Jun's 4.3260 high (as labeled in the weekly log active-continuation chart below) and
  • the 5-wave impulsive sub-division of Jun-Sep's (suspected initial 1st-Wave) decline

The recovery attempt from 26-Sep's 2.1877 low is arguably only a 3-wave (Wave-2) corrective rebuttal to Jun-Sep's decline within a massive, multi-quarter PEAK/reversal process.  Now granted, due to the magnitude of 2020 -2022's secular bull market, we discussed the prospect for this (2nd-Wave corrective) recovery to be "extensive" in terms of both price and time.  A "more extensive" correction is typified by a retracement of 61.8% or more and spanning weeks or even months following a 3-month decline.  Per such, the (suspected corrective) recovery from 26-Sep's 2.1877 low could easily have further to go, with commensurately larger-degree weakness than that exhibited this week (i.e., a failure below at least 2.4822) required to consider the correction complete.  Indeed, the daily log chart above shows the market thus far respecting former 2.6185-area resistance from 10-Oct as a new support candidate.

These issues considered, very shorter-term traders have been advised to move to a neutral/sideline position following overnight's momentum failure below 2.6328, with a recovery above 2.8172 required to negate this call, reaffirm the recovery and re-expose potentially significant gains thereafter.  For intermediate- and longer-term players, a bullish policy and exposure remain advised with a failure below 2.4822 required to threaten this call enough to warrant neutralizing exposure.  We will be watchful for another bearish divergence in momentum following a recovery attempt that falls short of Fri's 2.8172 high that would be considered the next reinforcing factor to a count calling that 2.8172 high the prospective end to the month-and-a-half 2nd-Wave correction.  In lieu of such, a resumption of the current rally to eventual new highs above 2.8172 should not surprise.

Coming Up Next Week...

View Futures Calendar