Experience a trading platform like no other with integrated tools to seamlessly trade and monitor the markets. With a free simulated trading account and personal broker experience, we’ll teach you about futures trading and help you develop a trading strategy. And, it’s Free to RJO Futures Clients, but you can demo it free today!
The Markets
Metals - Gold Looks to Break Out, Again!
Gold Looks to Break Out, Again!
By: Joshua GravesPosted 03/06/2020
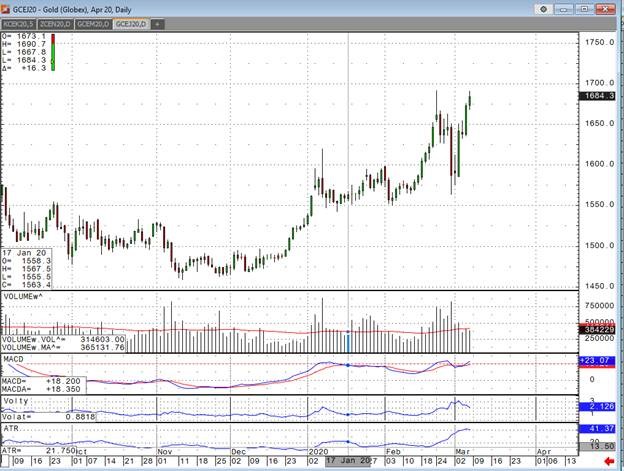
April gold has appeared to establish itself as a safe haven asset after extreme amounts of volatility over the past week. When investors pushed stocks down to well over 1000 in the Dow, gold, actually fell in the biggest sell-off in one day since 2013. At one point it was down over $73! Despite this contrarian reaction gold is now reaching for the stars as we near $1700 on the front month April contract. As I stated in my past article on gold, investors should be using extreme caution in this market as panic seems to set in each day pushing gold volatility well beyond the norms. Options are now expensive, and for a reason. Gold going higher still needs to be the trade, but how you structure this is dependent on risk appetite.
There are a number of strategies that have low risk and moderate reward and give investors exposure to a market that could easily push toward all-time highs of $2000. Although I am not aggressively bullish just yet, anyone who says that “gold can’t go there or can’t trade like this forever” clearly has not been in futures trading for long. These are turbulent times and rather than sit on the sidelines, try options strategies or some of the smaller gold futures contracts (10, 33, 50, 100 OZ are available to trade) to get exposure during the corona virus epidemic.
By: Eli Tesfaye, Senior Market StrategistPosted Mar 6, 2020 9:26AM CT
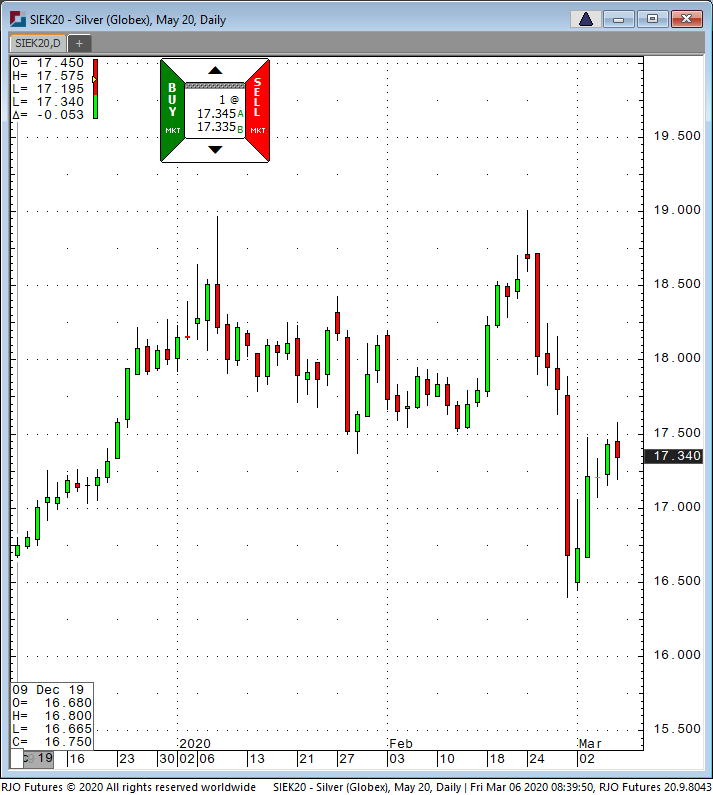
The Dow is down 800 points at the time of this writing, and although silver is not headed to the moon, the path to least resistance still up. An exciting week with the Fed "aggressive" rate cut is forcing the market to take a deeper dive, but for now, let's call it a correction. The fear of the Covid-19 virus has made its way with the markets, but common logic will soon prevail. It is not that the virus isn't dangerous and killed people, but most of my reading discusses its similarity to the common flu. Look, the equity market was long overdue for a decent correction anyways, so I wasn't surprised about that. What surprised me and others the most was the fact that the FED went nuts with their rate cut of 50 base points. The last thing this market needs is a scared Fed. Supposedly, this will be a global coordinated effort to keep markets afloat globally. So far, I'm not convinced, but I could be wrong. All I know is that silver is taking advantage of it. Consider buying dips provided you have an appropriate "risk asset."
The technical outlook remain strong, although it may close on lower side here, you really need a close below 16.60 in the front month May futures contract for the bears to have a better edge.
Silver May '20 Daily Chart If you have any questions or would like to discuss the markets further, please feel free to contact me at 800-367-7290 or etesfaye@rjofutures.com. Energy - Oil Dumps Following OPEC Fallout
Oil Dumps Following OPEC Fallout
By: Alex Turro, Senior Market StrategistPosted Mar 6, 2020 9:45AM CT
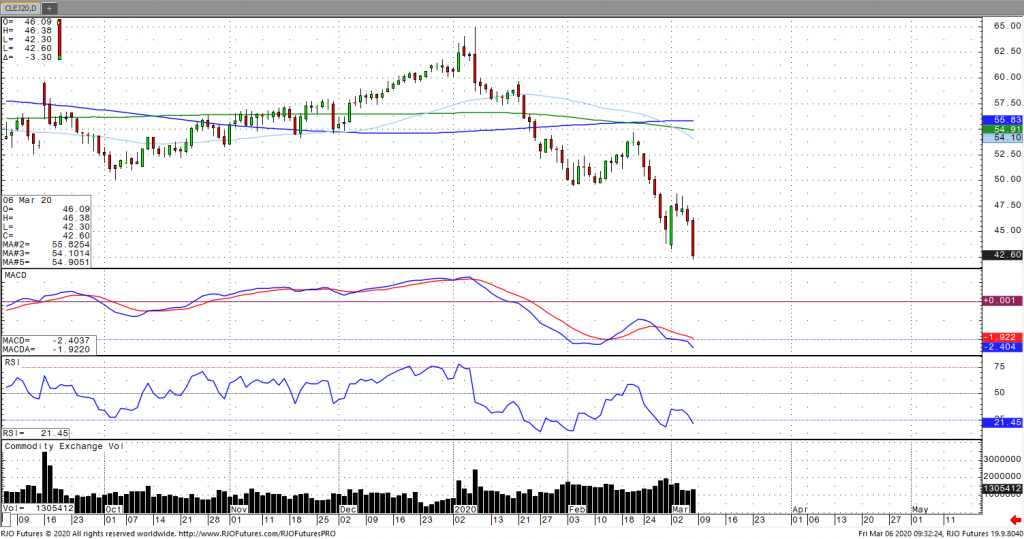
Oil prices dropped over 6% on Friday to multi-year lows following reports that Russia has not agreed to addition production cuts in excess of 1.5 million barrels per day, despite ongoing fleeting demand concerns due to the virus outbreak. Reports that Russia would only comply to extensions but not deeper cuts with non-OPEC states expecting to contribute 500,000 bpd, which would have brought the total to 3.6 million bpd, or about 3.6% of global supply. Despite lowered demand forecasts Russian Energy Minister Novak reiterated that the fallout was too early to assess. Reports by the IMF that the Chinese economy is operating at a 60% capacity has been largely discounted. Weekly U.S. crude stocks increase came in less than expected and the U.S. refinery rate declined, which alludes to the idea that U.S. crude supply may be limited in form. The market remains bearish trend with today’s range seen between 43.02 – 47.71.
Crude Oil Apr '20 Daily Chart If you have any questions or would like to discuss the markets further, please feel free to contact me at 800-438-4805 or aturro@rjofutures.com. Softs - Are Sugar Futures a Bullish Opportunity?
Are Sugar Futures a Bullish Opportunity?
By: Eric ScolesPosted 03/04/2020
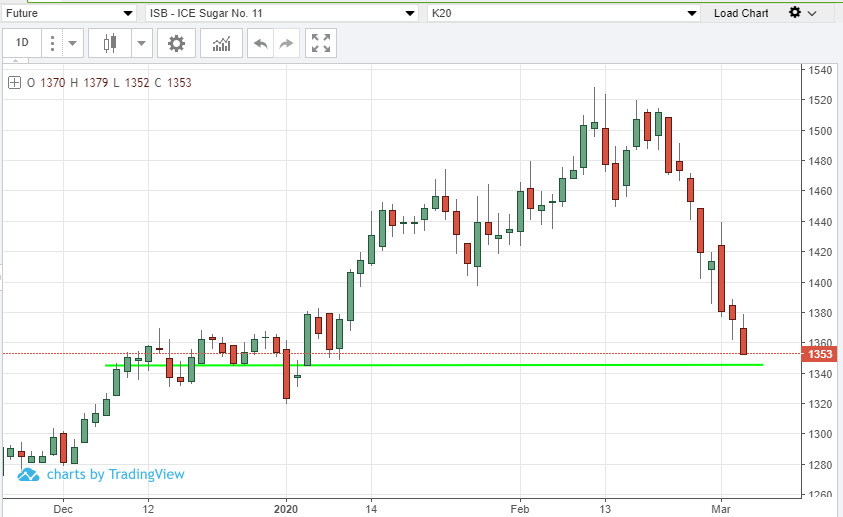
May ’20 sugar futures are under continued pressure of long liquidation since the coronavirus wash-out in the markets started towards the end of February. The fundamentals however, are still strongly bullish in this market with the expected global production deficit this season, and potential for another next season. Sugar futures are much like coffee in that they will stick consistently to an established trend, and so the long liquidation continues until it runs out of steam. There appears to be firm support on the daily chart at 13.45 which I wouldn’t be surprised if we reach, but my analysis suggests that level is likely to hold. With such strong fundamentals I see sugar as being heavily undervalued at these prices, and from a technical perspective this market is over-sold. The selling should dry up soon, and when it does I think sugar futures will become an excellent bullish opportunity.
On
the heels of mid-Sep-to-early-Oct's steeper, accelerated, 3rd-wave-looking
recovery, the past week-and-a-half's boringly lateral chop is first considered
a corrective/consolidative event that warns of a continuation of the uptrend
that preceded it to new highs above 04-Oct's 891.0 high. This count
remains consistent with our broader base/correction/recovery count introduced
in 13-Sep's Technical Blog following that
day's bullish divergence in short-term momentum above 07-Sep's 809.5 minor
corrective high detailed in the hourly chart below.
The
important takeaway from this month's lateral, sleepy price action is the
definition of Wed's 851.5 low as
the end or lower boundary of a suspected 4th-Wave correction. A failure
below 851.5 will confirm a bearish divergence in daily momentum and defer or
threaten a bullish count enough to warrant non-bullish decisions like
long-covers. A failure below 851.5 will not
necessarily negate a broader bullish count, but it will threaten it enough to
warrant defensive measures as the next pertinent technical levels below 851.5 are
13-Sep's prospective minor 1st-Wave high at 813.8 and obviously 08-Sep's 766.0
low. And making non-bullish decisions "down there" is
sub-optimal to say the least. Per such, both short- and longer-term
commercial traders are advised to pare or neutralize bullish exposure on a
failure below 851.5, acknowledging and accepting whipsaw risk- back above 04-Oct's
891.0 high- in exchange for much deeper and sub-optimal nominal risk below
766.0.
On
a broader scale, the daily log scale chart above shows the developing potential
for a bearish divergence in daily momentum that will be considered confirmed
below 851.5. This chart also shows the past month's recovery thus far
stalling in the immediate neighborhood of the (888.0) Fibonacci
minimum 38.2% retrace of Apr-Sep's entire 1128 - 766 decline). COMBINED
with a failure below 851.5, traders
would then need to be concerned with at least a larger-degree correction pf the
past month's rally and possibly a resumption of Apr-Sep's major downtrend.
Until
and unless the market fails below 851.5 however, we would
remind longer-term players of the key elements on which our bullish count is
predicated:
a confirmed bullish divergence in WEEKLY momentum
(below)
amidst
an
historically low 11% reading in out RJO Bullish Sentiment Index and
a
textbook complete and major 5-wave Elliott sequence down from 29-Apr's
1128 high to 08-Sep's 766.0 low.
Thus
far, the market is only a month into correcting a 4-MONTH, 32% drawdown, so
further and possibly protracted gains remain well within the bounds of a major
(suspected 2nd-Wave) correction of Apr-Sep's decline within an even more
massive PEAK/reversal process from 17-May's 1219 high on an active continuation
basis below.
These
issues considered, a bullish policy and exposure remain advised with a failure
below 851.5 required to defer or threaten this call enough to warrant moving to
a neutral/sideline position. In lieu of such weakness, we anticipate a
continuation of the past month's rally to new highs and potentially significant
gains above 891.0.
Agricultural - Grain Futures Update w/Stephen Davis - 03/06/2020
Grain Futures Update w/Stephen Davis - 03/06/2020
By: Stephen DavisPosted 03/06/2020
Stephen Davis discusses the latest volatility in the grain markets. With U.S. stocks down across the board, grains are down too. With the exception of wheat, which interestingly seems to have an inverse relationship with the stocks.
Cattle demand remains in question and will remain in question until there is more certainty about the coronavirus, at least for the near term. If the consumers continue to have a “go nowhere/do nothing” kind of attitude, then not only does the demand fall, but there will be a backup of supply for both the short-term and into the year. At this point, any rally in cattle look like an opportunity to short the market. After yesterday’s sell-off of nearly 265 points, the market is technically oversold, but I think the fundamentals outweigh the technical in this situation because the spread of this coronavirus across the U.S. could continue to curtail beef demand. The USDA boxed beef cutout was up $1.25 at mid-session yesterday but closed just 9-cents higher at $206.62. This was down from $207.47 the previous week and down from $223.55 a year ago. Cash live cattle trade has been quiet this week, with no trades reported as of Tuesday afternoon. This follows declines of roughly $5/cwt last week. The USDA estimated cattle slaughter came in at 124,000 head yesterday. This brings the total for the week so far to 245,000 head, up from 242,000 last week at this time and up from 238,000 a year ago.
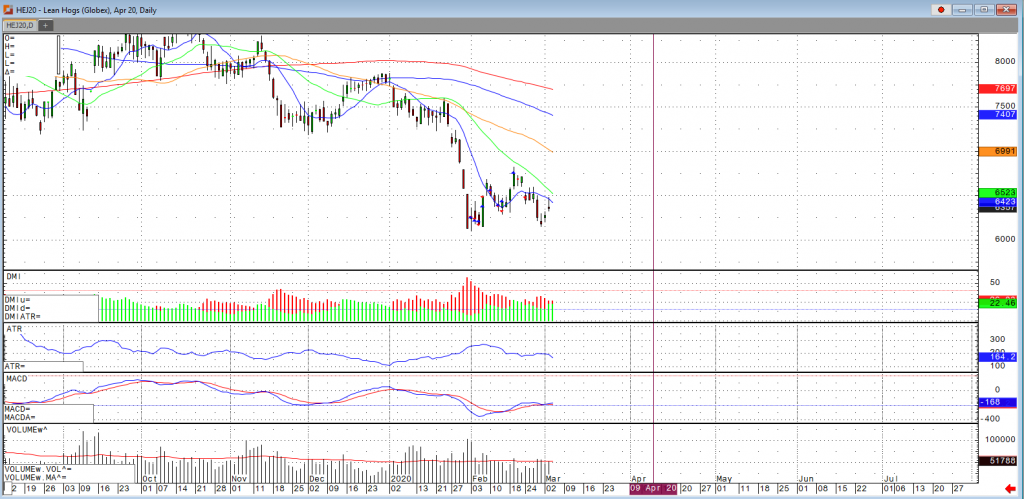
Surprisingly, lean hogs seem to be avoiding this virus mainly due to export shipments remaining strong. If they continue to do so, then the market looks poised for a nice recovery off the Feb lows. April hogs are still holding a substantial premium over the cash market at this time and with the drop in production, this appears to be justified. The CME lean hog index as of February 28th came in at 56.25, down from 56.33 the previous session but up from 55.91 a week before. The USDA estimated hog slaughter came in at 495,000 head yesterday. This brings the total for the week so far to 990,000 head, unchanged from last week, but up from 938,000 a year ago. The USDA pork cutout, released after the close yesterday, came in at $64.84, down 80 cents from $65.41 on Monday and down from $65.03 the previous week.
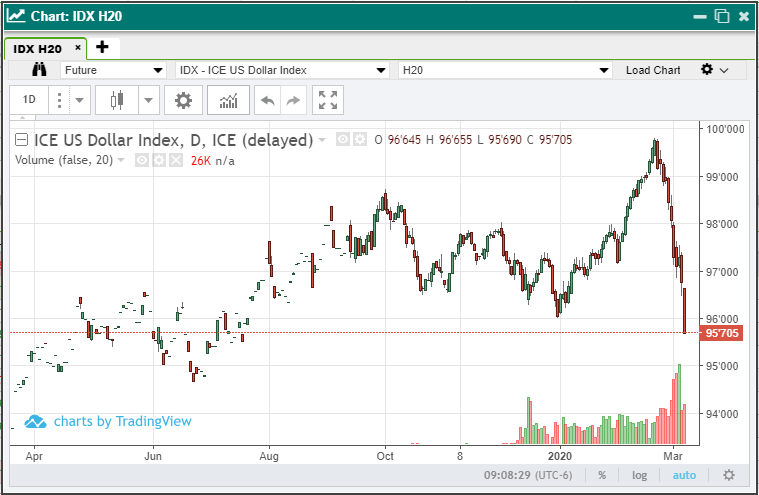
March U.S. dollar futures gapped lower overnight and are trading 90 points below the opening price Friday morning. In short, the top is in and the days of King Dollar seem to be over. This follows an emergency 50-bps rate cut earlier this week and projections for ANOTHER 50-bps rate cut at the March 18th meeting are now at 75% according to the CME. Foreign currencies are rocketing higher, led by the euro and the Swiss franc. Safe-haven currencies are seeing an influx of buying as the stock market decline continues. The Japanese yen is this week’s winner, trading above the 95 level for the first time since August. The Swiss also carries some safe-haven qualities. So, what’s next? Probably more of the same. Currency moves this week signal major reversals. A paradigm shift is among us as the major economies of the world are showing clear signs of slowdowns that are being exasperated by the coronavirus. Support in the dollar will not likely be seen until last June’s low of 95.365. Volatility has returned and currency traders should tread carefully as central banks around the world coordinate monetary easing.
USD Mar '20 Daily ChartEquity - Virus Trumps Jobs
Virus Trumps Jobs
By: Jeff Yasak, Senior Market StrategistPosted Mar 6, 2020 9:42AM CT
We were warned, by many top economists, that the February jobs
report was going to be irrelevant. The
data was collected before the coronavirus outbreak escalated and became a
threat to our financial system. 273,000 jobs were added in February
while analysts had expected a gain of about 165,000. The unemployment rate fell
from 3.6% to 3.5%, matching a 50-year low. Average hourly earnings rose by 0.3
percent the year-over-year gain is now 3 percent.
Chris Rupkey, head economist for MUFG Union Bank, stated Friday morning. “This could be the last perfect employment report the market gets for some time. Net, net, the employment report was nearly perfect in February before the growing economic storm posed by the spreading coronavirus around the country that threatens many industries where the public gathers from movies, to travel, to the airline industry, even shops and malls.”
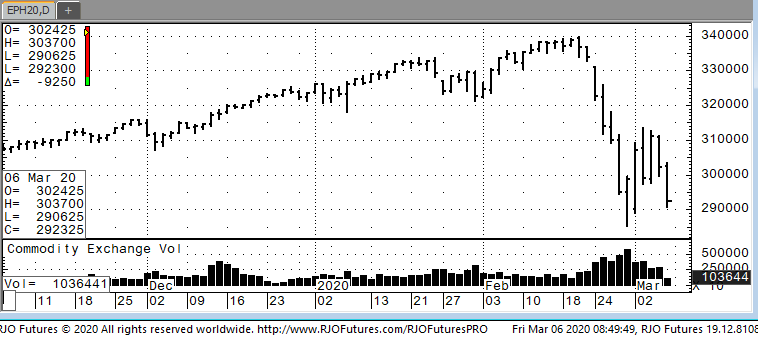
E-mini S&P 500 Mar '20 Daily Chart If you have any questions or would like to discuss the markets further, please feel free to contact me at 888-861-1656 or jyasak@rjofutures.com. Economy - S-T Mo Failure Insufficient to End RBOB Correction, But Beware
S-T Mo Failure Insufficient to End RBOB Correction, But Beware
By: RJO Market InsightsPosted 11/08/2022
Posted on Nov 08, 2022, 07:51 by Dave Toth
In Fri's Technical Webcast we identified a
minor corrective low at 2.6328 from Thur as a mini risk parameter the market
needed to sustain gains above to maintain a more immediate bullish count.
The 240-min chart below shows the market's failure overnight below this level,
confirming a bearish divergence in very short-term momentum. This mo
failure defines Fri's 2.8172 high as
one of developing importance and a parameter from which very short-term traders
can objectively base non-bullish decisions like long-covers.
Given
the magnitude of the past three weeks' broader recovery however, this
short-term momentum failure is of an insufficient scale to conclude anything
more than another correction within this broader recovery from 26-Sep's 2.1877
low. Indeed, overnights failure below 2.6328 only allows us to conclude
the end of the portion of the month-and-a-half rally from 31-Oct's 2.4822 next
larger-degree corrective low. 2.4822 is the
risk parameter this market still needs to fail below to break the uptrend from
18-Oct's 2.3526 low while this 2.3526 low
remains intact as the risk parameter this market needs to fail below to break
the month-and-a-half uptrend. From an
intermediate-to-longer-term perspective, this week's setback falls well within
the bounds of another correction ahead of further gains. This is another
excellent example of the importance of technical and trading SCALE and
understanding and matching directional risk exposure to one's personal risk
profile.
The
reason overnight's admittedly minor mo failure might have longer-term
importance is the 2.8172-area from which it stemmed. In
Fri's Technical Blog we also noted the market's engagement of the
2.8076-to-2.8159-area marked by the 61.8% retrace of Jun0-Sewp's 3.2758 -2.1877
decline and the 1.000 progression of Sep-Oct's initial 2.1877 - 2.6185
(suspected a-Wave) rally from 18-Oct's 2.3526 (suspected b-Wave) low. We
remind longer-term players that because of the unique and compelling confluence
of:
early-Aug's bearish divergence in WEEKLY momentum
amidst
historically
extreme bullish sentiment/contrary opinion levels in our RJO Bullish
Sentiment Index
an
arguably complete and massive 5-wave Elliott sequence from Mar'20's 0.4605
low to Jun's 4.3260 high (as labeled in the weekly log active-continuation
chart below) and
the
5-wave impulsive sub-division of Jun-Sep's (suspected initial 1st-Wave) decline
The
recovery attempt from 26-Sep's 2.1877 low is arguably only a 3-wave (Wave-2)
corrective rebuttal to Jun-Sep's decline within a massive, multi-quarter
PEAK/reversal process. Now granted, due to the magnitude of 2020 -2022's
secular bull market, we discussed the prospect for this (2nd-Wave corrective)
recovery to be "extensive" in terms of both price and time. A
"more extensive" correction is typified by a retracement of 61.8% or
more and spanning weeks or even months following a 3-month decline. Per
such, the (suspected corrective) recovery from 26-Sep's 2.1877 low could easily
have further to go, with commensurately larger-degree weakness than that
exhibited this week (i.e., a failure below at least 2.4822) required
to consider the correction complete. Indeed, the daily log chart above
shows the market thus far respecting former 2.6185-area resistance from 10-Oct
as a new support candidate.
These
issues considered, very shorter-term traders have been advised to move to a neutral/sideline
position following overnight's momentum failure below 2.6328, with a recovery
above 2.8172 required to negate this call, reaffirm the recovery and re-expose
potentially significant gains thereafter. For intermediate- and
longer-term players, a bullish policy and exposure remain advised with a
failure below 2.4822 required to threaten this call enough to warrant
neutralizing exposure. We will be watchful for another bearish divergence
in momentum following a recovery attempt that falls short of Fri's 2.8172 high
that would be considered the next reinforcing factor to a count calling that
2.8172 high the prospective end to the month-and-a-half 2nd-Wave
correction. In lieu of such, a resumption of the current rally to
eventual new highs above 2.8172 should not surprise.