Experience a trading platform like no other with integrated tools to seamlessly trade and monitor the markets. With a free simulated trading account and personal broker experience, we’ll teach you about futures trading and help you develop a trading strategy.
The Markets
Metals - Where is Gold Going Next
Where is Gold Going Next
By: Nicholas DeGeorgePosted 03/13/2020
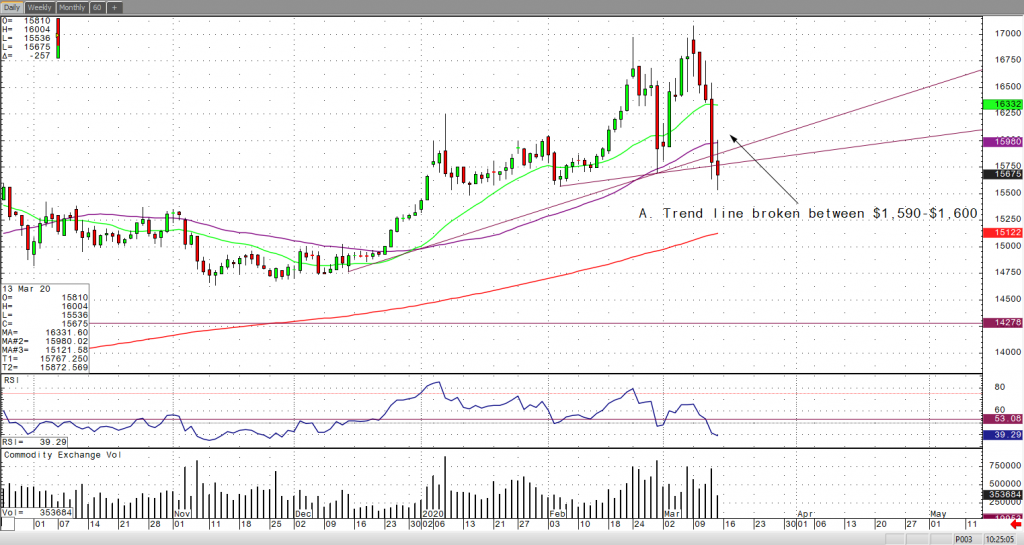
In the early morning trade, June gold is trading in the red
again and currently trading at $1,575 and continuing it’s more than $120
sell-off from last week’s high of $1,707. With everything going on this week
gold should have been a safe-haven, but it was the exact opposite. For example,
the Feds coming up with quantitative easing and China stepping up with another
stimulus plan as the coronavirus gets more worse throughout the world. Those
two actions should of help, but too many people probably had to meet margin calls,
so they had to sell their gold. Over time, I believe gold should prop back up
as they take effect.
If we look at the daily June gold chart, you’ll clearly see that the uptrend was broken this week and is now in bullish trend. However, forget the technical because the fundamentals are going to drive this market in its next direction.
Gold Jun '20 Daily ChartEnergy - Oil Glut to Remain
Oil Glut to Remain
By: Alex Turro, Senior Market StrategistPosted Mar 13, 2020 9:29AM CT
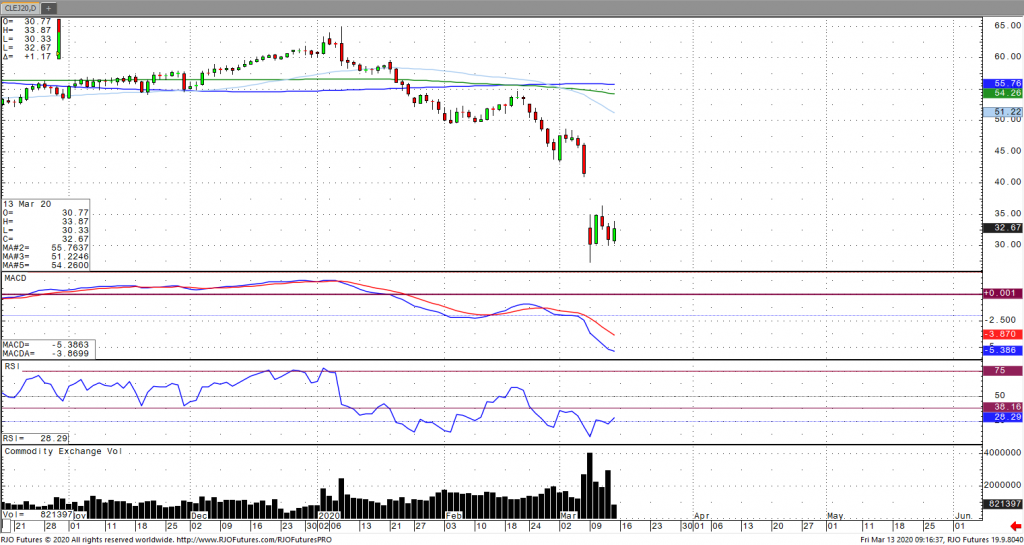
After crashing over 30% in the last week amid a broad decline in global equity markets and the US banning travel from Europe on Wednesday following the World Health Organization’s declaration of the virus a pandemic, prices are experiencing a minor corrective bounce this morning. Oil has been under pressure as OPEC and Russia are threatening to flood the market with oil demand growth forecasts continually revised lower and to their lowest in nearly a decade as the four-year effort to curtail supply is set to expire. Both WTI and Brent are down nearly 50% since their January high and had their largest one-day declines on Monday since the Gulf War. The US Energy Information Administration (EIA) and OPEC had already cut demand forecast even prior to the breakout of the virus with expectations of a further contraction in the first quarter. Weekly inventories displayed minimal effect from the virus as stocks increased by 7.7 million barrels with inventories of gasoline and diesel falling. Oil remains bearish trend with today’s range seen between 28.61 – 35.38.
Crude Oil Apr '20 Daily Chart If you have any questions or would like to discuss the markets further, please feel free to contact me at 800-438-4805 or aturro@rjofutures.com. Softs - Global Economic Slowdown Could Weaken Demand of Cocoa
Global Economic Slowdown Could Weaken Demand of Cocoa
By: Peter MoosesPosted 03/13/2020
As
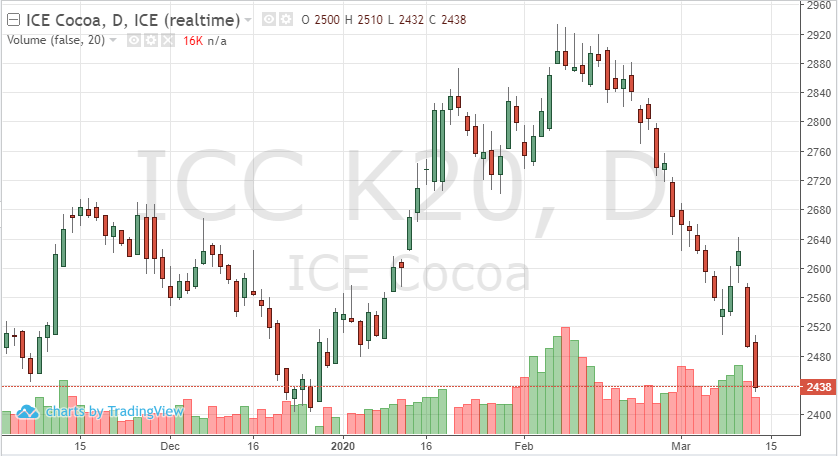
we continue volatility in every market, cocoa continues to move lower. As the
May contract tests lows put in at the end of 2019, demand for chocolate could
take front stage for cocoa futures. As the NBA, NHL, MLB and most other
professional and minor league sports and teams postpone play until further
notice due to the Coronavirus, cocoa could be one of the futures most affected.
Since chocolate is a good indicator of cocoa demand and it’s sold at many
entertainment venues, this suspension of play could affect futures’ prices.
Each trading day appears to be different as more news breaks daily on the virus. As traders try to position themselves in commodities, a close eye is needed. The fundamentals will control most markets in the near-future, the technicals will provide guidance on quieter trading days. Look to see if 2425 holds and if the cocoa and global markets can recover next week.
Cocoa May '20 Daily ChartSofts - Massive Swings in Coffee Prices
Massive Swings in Coffee Prices
By: Adam TuiaanaPosted 03/11/2020
Most commodities markets continue to have massive,
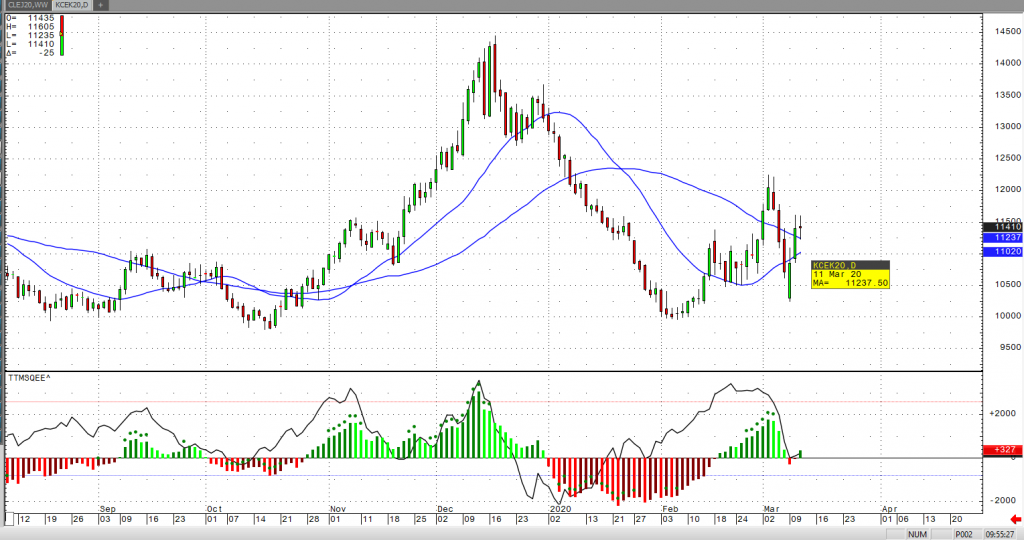
volatile swings, and May coffee is no exception. A massive short covering rally
pushed May coffee prices high enough to challenge the 115 level, and possibly
prompt a continued run back to the 120+ highs we saw earlier this month. The
Brazilian currency experienced a boost from a dwindling US Dollar, which helped
May coffee prices to find support. In addition, there has been reported wet
weather in key growing areas of Brazil that have prompted additional long-term
support for coffee prices. Our friends at The Hightower Group have reported
that “heavy rainfall over Brazil’s Minas
Gerais growing areas could have a negative impact on their upcoming crop if
they continue over the next few weeks”.
While the markets continue to display unprecedented
volatility as the world struggles to cope with the Coronavirus, commodities
will continue to find unstable ground as the underlying fundamentals bear
little (if any) impact on the overall price action we continue to witness these
days.
From a technical perspective, we have been able to hold support above the 99.55 critical low from February of this year, with a subsequent strong bounce to the 116 level. This price action should be viewed as a potential long-term bottom in May coffee, but with the continued uncertainty related to the Coronavirus, we should expect more sideways price action with massive swings.
On
the heels of mid-Sep-to-early-Oct's steeper, accelerated, 3rd-wave-looking
recovery, the past week-and-a-half's boringly lateral chop is first considered
a corrective/consolidative event that warns of a continuation of the uptrend
that preceded it to new highs above 04-Oct's 891.0 high. This count
remains consistent with our broader base/correction/recovery count introduced
in 13-Sep's Technical Blog following that
day's bullish divergence in short-term momentum above 07-Sep's 809.5 minor
corrective high detailed in the hourly chart below.
The
important takeaway from this month's lateral, sleepy price action is the
definition of Wed's 851.5 low as
the end or lower boundary of a suspected 4th-Wave correction. A failure
below 851.5 will confirm a bearish divergence in daily momentum and defer or
threaten a bullish count enough to warrant non-bullish decisions like
long-covers. A failure below 851.5 will not
necessarily negate a broader bullish count, but it will threaten it enough to
warrant defensive measures as the next pertinent technical levels below 851.5 are
13-Sep's prospective minor 1st-Wave high at 813.8 and obviously 08-Sep's 766.0
low. And making non-bullish decisions "down there" is
sub-optimal to say the least. Per such, both short- and longer-term
commercial traders are advised to pare or neutralize bullish exposure on a
failure below 851.5, acknowledging and accepting whipsaw risk- back above 04-Oct's
891.0 high- in exchange for much deeper and sub-optimal nominal risk below
766.0.
On
a broader scale, the daily log scale chart above shows the developing potential
for a bearish divergence in daily momentum that will be considered confirmed
below 851.5. This chart also shows the past month's recovery thus far
stalling in the immediate neighborhood of the (888.0) Fibonacci
minimum 38.2% retrace of Apr-Sep's entire 1128 - 766 decline). COMBINED
with a failure below 851.5, traders
would then need to be concerned with at least a larger-degree correction pf the
past month's rally and possibly a resumption of Apr-Sep's major downtrend.
Until
and unless the market fails below 851.5 however, we would
remind longer-term players of the key elements on which our bullish count is
predicated:
a confirmed bullish divergence in WEEKLY momentum
(below)
amidst
an
historically low 11% reading in out RJO Bullish Sentiment Index and
a
textbook complete and major 5-wave Elliott sequence down from 29-Apr's
1128 high to 08-Sep's 766.0 low.
Thus
far, the market is only a month into correcting a 4-MONTH, 32% drawdown, so
further and possibly protracted gains remain well within the bounds of a major
(suspected 2nd-Wave) correction of Apr-Sep's decline within an even more
massive PEAK/reversal process from 17-May's 1219 high on an active continuation
basis below.
These
issues considered, a bullish policy and exposure remain advised with a failure
below 851.5 required to defer or threaten this call enough to warrant moving to
a neutral/sideline position. In lieu of such weakness, we anticipate a
continuation of the past month's rally to new highs and potentially significant
gains above 891.0.
Agricultural - Grain Futures Update w/Stephen Davis - 03/13/2020
Grain Futures Update w/Stephen Davis - 03/13/2020
By: Stephen DavisPosted 03/13/2020
Stephen Davis discusses the latest in the grain markets. While coronavirus has certainly slowed everything, the markets look a little better today. Corn is being planted down south, and we could see the market pull upInterest Rates - Interest Rates Can't Find a Level, Coronavirus Rages On
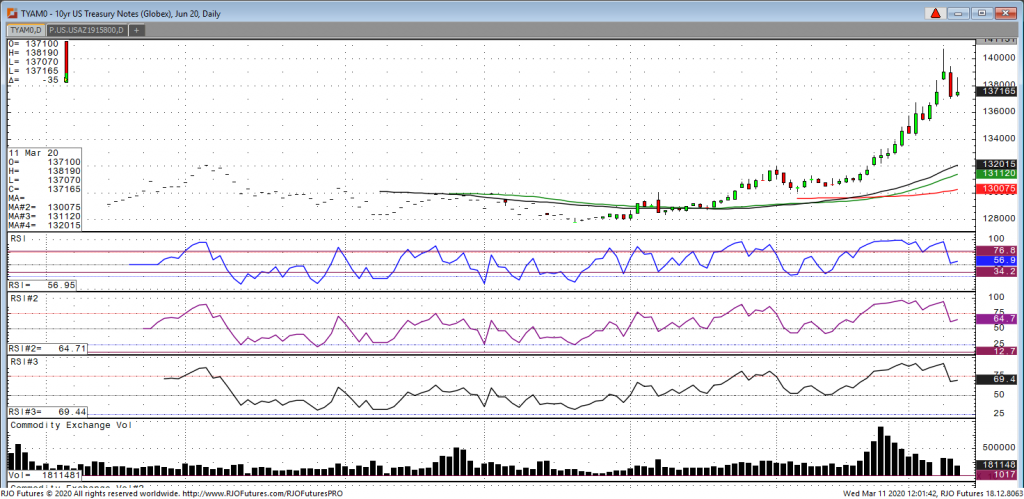
Interest Rates Can't Find a Level, Coronavirus Rages On
Taking a look at the 10-year note, we are currently trading 137.22, up 2 ticks on the day. Overnight we had a high of 138-19 and a low of 137-07. The market continues to take cues from any new developments on the coronavirus and the stock market. On Monday we touched the lowest level in the 10-year based on yield, and the highest price in the futures on record as the stock market tumbled. I believe we all recognize that coronavirus is a pandemic and about fifteen minutes ago the WHO just declared it as such. What is interesting for traders is that the 10-year note is currently down 2 ticks and Gold down $12, all while the Dow is down 1100 points. It’s a bit confusing why the notes are lower and not catching a bid while the stock market is down big today. My advice to traders looking at the note complex is continue to be a buyer on dips. It doesn’t look like the virus is slowing down at all. Italy is basically shut down and many universities and colleges in the states are sending students home and will be telecommuting for the near future. The panic of this virus remains and if people are not getting tested as the government suggests, the possibility of continued spread among individuals seems high.
10-Year Note Jun '20 Daily Chart If you have any questions or would like to discuss the markets further, please feel free to contact me at 800-826-2270 or gperlin@rjofutures.com. Equity - Coronavirus Sparks Panic Selling in Stock Futures
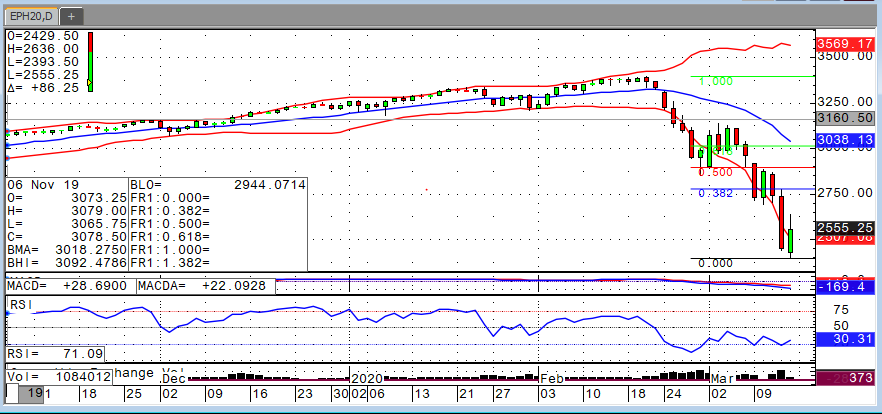
Coronavirus Sparks Panic Selling in Stock Futures
By: Ian BannonPosted 03/13/2020
U.S. stock markets are having their worst week since the 2008 financial crisis. Thursday’s avalanche marks the largest one-day sell-off since 1987. In short, markets are in turmoil due to fears that the coronavirus threat will worsen, and economic activity will grind to a halt. This has been an evolving problem globally, but the effects are being firmly felt in America this week. Schools are closing, and large events are being cancelled as the virus multiplies every day. March S&P futures went limit up Friday morning before selling off again. It looks like more downside is in order as we head into the St. Patrick’s Day weekend. The chances that this virus will simply stop spreading over the next couple of weeks is next to nothing. Certainly, things will get worse before they get better as the market panic would imply. For the long-term investor, this will provide opportunity. But for the bottom-picker, this has provided only pain. Recovery rallies have been unable to hold. Friday morning, the Dow Jones is 26% off its all-time high last month. Testing the 38.2% Fib retracement level would only put the S&P back to Thursday’s high. The takeaway this week – just because it’s cheap doesn’t mean it’s a buy… tread carefully.
E-mini S&P 500 Mar '20 Daily ChartEconomy - S-T Mo Failure Insufficient to End RBOB Correction, But Beware
S-T Mo Failure Insufficient to End RBOB Correction, But Beware
By: RJO Market InsightsPosted 11/08/2022
Posted on Nov 08, 2022, 07:51 by Dave Toth
In Fri's Technical Webcast we identified a
minor corrective low at 2.6328 from Thur as a mini risk parameter the market
needed to sustain gains above to maintain a more immediate bullish count.
The 240-min chart below shows the market's failure overnight below this level,
confirming a bearish divergence in very short-term momentum. This mo
failure defines Fri's 2.8172 high as
one of developing importance and a parameter from which very short-term traders
can objectively base non-bullish decisions like long-covers.
Given
the magnitude of the past three weeks' broader recovery however, this
short-term momentum failure is of an insufficient scale to conclude anything
more than another correction within this broader recovery from 26-Sep's 2.1877
low. Indeed, overnights failure below 2.6328 only allows us to conclude
the end of the portion of the month-and-a-half rally from 31-Oct's 2.4822 next
larger-degree corrective low. 2.4822 is the
risk parameter this market still needs to fail below to break the uptrend from
18-Oct's 2.3526 low while this 2.3526 low
remains intact as the risk parameter this market needs to fail below to break
the month-and-a-half uptrend. From an
intermediate-to-longer-term perspective, this week's setback falls well within
the bounds of another correction ahead of further gains. This is another
excellent example of the importance of technical and trading SCALE and
understanding and matching directional risk exposure to one's personal risk
profile.
The
reason overnight's admittedly minor mo failure might have longer-term
importance is the 2.8172-area from which it stemmed. In
Fri's Technical Blog we also noted the market's engagement of the
2.8076-to-2.8159-area marked by the 61.8% retrace of Jun0-Sewp's 3.2758 -2.1877
decline and the 1.000 progression of Sep-Oct's initial 2.1877 - 2.6185
(suspected a-Wave) rally from 18-Oct's 2.3526 (suspected b-Wave) low. We
remind longer-term players that because of the unique and compelling confluence
of:
early-Aug's bearish divergence in WEEKLY momentum
amidst
historically
extreme bullish sentiment/contrary opinion levels in our RJO Bullish
Sentiment Index
an
arguably complete and massive 5-wave Elliott sequence from Mar'20's 0.4605
low to Jun's 4.3260 high (as labeled in the weekly log active-continuation
chart below) and
the
5-wave impulsive sub-division of Jun-Sep's (suspected initial 1st-Wave) decline
The
recovery attempt from 26-Sep's 2.1877 low is arguably only a 3-wave (Wave-2)
corrective rebuttal to Jun-Sep's decline within a massive, multi-quarter
PEAK/reversal process. Now granted, due to the magnitude of 2020 -2022's
secular bull market, we discussed the prospect for this (2nd-Wave corrective)
recovery to be "extensive" in terms of both price and time. A
"more extensive" correction is typified by a retracement of 61.8% or
more and spanning weeks or even months following a 3-month decline. Per
such, the (suspected corrective) recovery from 26-Sep's 2.1877 low could easily
have further to go, with commensurately larger-degree weakness than that
exhibited this week (i.e., a failure below at least 2.4822) required
to consider the correction complete. Indeed, the daily log chart above
shows the market thus far respecting former 2.6185-area resistance from 10-Oct
as a new support candidate.
These
issues considered, very shorter-term traders have been advised to move to a neutral/sideline
position following overnight's momentum failure below 2.6328, with a recovery
above 2.8172 required to negate this call, reaffirm the recovery and re-expose
potentially significant gains thereafter. For intermediate- and
longer-term players, a bullish policy and exposure remain advised with a
failure below 2.4822 required to threaten this call enough to warrant
neutralizing exposure. We will be watchful for another bearish divergence
in momentum following a recovery attempt that falls short of Fri's 2.8172 high
that would be considered the next reinforcing factor to a count calling that
2.8172 high the prospective end to the month-and-a-half 2nd-Wave
correction. In lieu of such, a resumption of the current rally to
eventual new highs above 2.8172 should not surprise.