How technical analysis differs from trading strategy
Why is price action so important
How to implement a trading strategy
RJO Echo Trading
Attention New or Frustrated Traders:
Do you want to get into futures trading, but don’t have the time or knowledge necessary to do so? RJO Echo Trading is an intuitive way for investors or “echo followers” to automatically match the performance of veteran and accomplished traders. As an “Echo Follower” you will choose from a selection of vetted and experienced “Echo Leaders”, all you have to do is pay a subscription fee and your account will mimic the trades of your chosen “Leader”. Echo Trading eliminates the learning curve needed to trade futures, making it an option for all.
The Markets
Metals - Gold Tries to Shine, Again
Gold Tries to Shine, Again
By: Joshua GravesPosted 05/15/2020
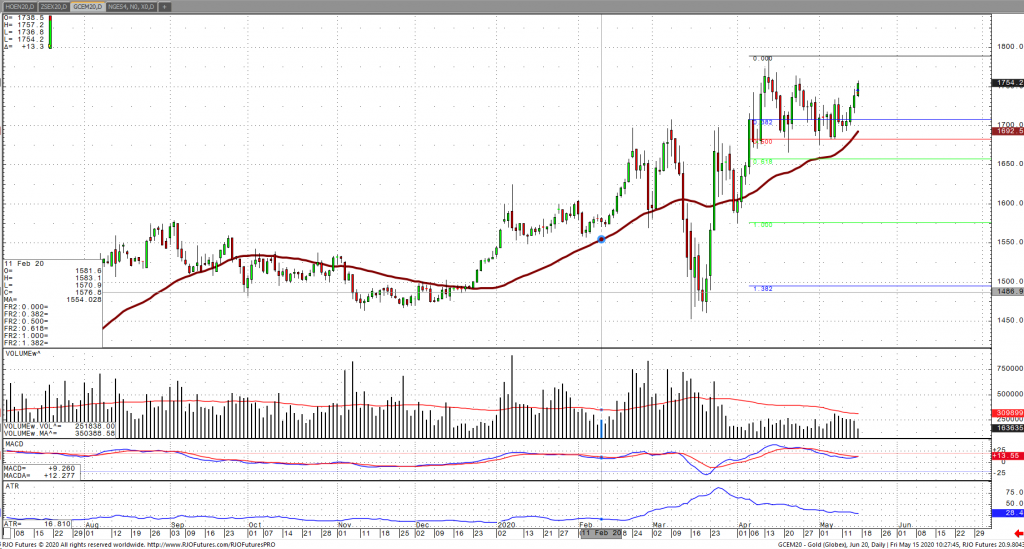
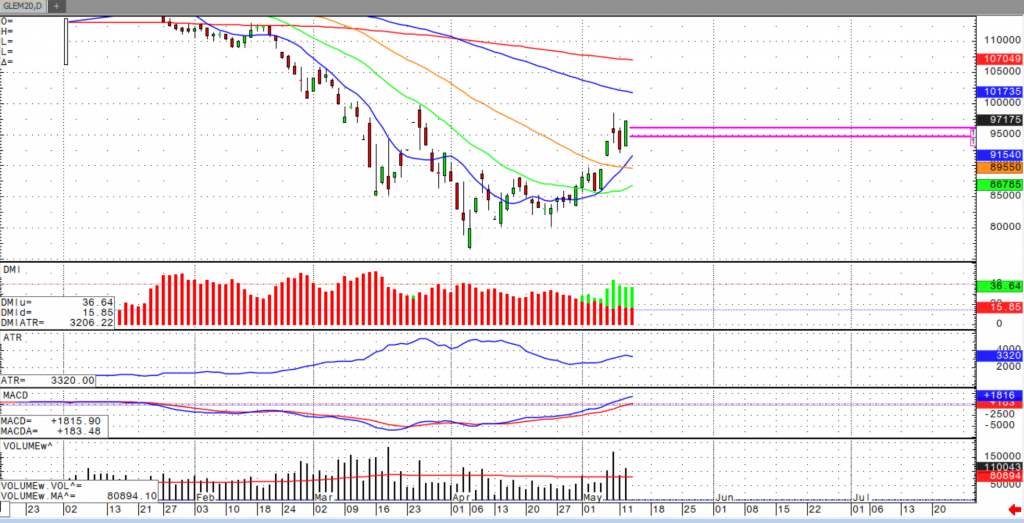
June gold futures have once again, shown that discounting a potential run to the highs in gold is a bad idea. I have not been overly bullish or bearish the metal over the past few weeks, mainly because it doesn’t seem to be trading based on the usual “stocks down gold up” type of move and rather sideways in nature. I’ve seen days where gold has soared along with stocks and just the opposite; the most notable being the market crash in March that took gold down with it. My view of the gold market has no bearing to where it will go, however, the price action along with silver futures today has be believing that if it does continue higher gold should catch some of the wind pushing silver.
Fundamentally, I could make a case either way from the fed printing too much money being bullish but bearish with industrial demand in India and China weakening putting pressure on the gold long term. A good trader knows when to stop listening to the constant noise in the market and start looking at technical trading, more so than what you usually would. Gold held a 50% retracement level from April 1 until now, which came in at 1680 on the June contract. June gold does look much better than it did just a week ago, and it will look even better on a close above the contract high. When this happens, traders shouldn’t immediately press the bet, but rather wait for the first dip once it’s made that move above 1790. Options in conjunction with futures are a great way to trade with limited risk and excellent reward potential.
Gold Jun '20 Daily ChartMetals - Silver Outperforming Gold
Silver Outperforming Gold
By: Eli Tesfaye, Senior Market StrategistPosted May 15, 2020 9:12AM CT
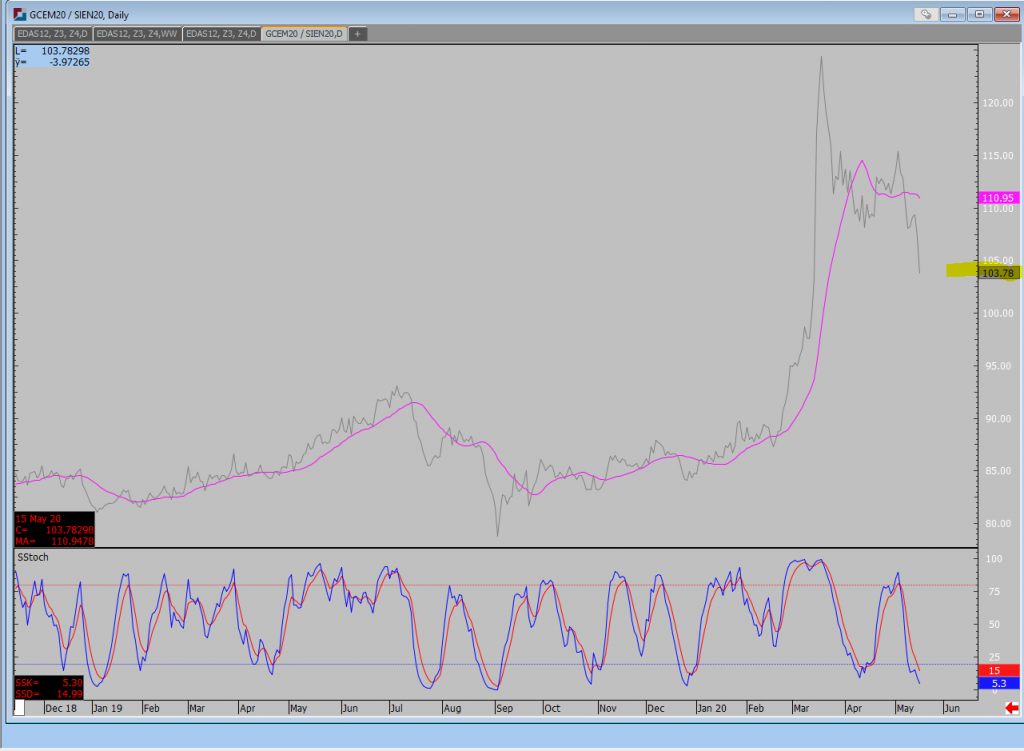
This morning, the picture is worth more than 1000 words. Front month delivery silver is up 67-cents on the day to $16.84. I have attached a chart of Gold/Silver ratio. I really like looking at relationships in approaching markets.
As you can see clearly below, the COVID-19 ruled world we live in is welcoming silver with open arms. The country is in the process of reopening, thanks to the phenomenal work of first responders. Seeing the Blue Angles fly over Chicago, you can’t help it be proud of all the efforts and the fights that continue to this day. We wish all the Governors, the best of luck.
Back to silver, the technicals look good to the bulls as breakout of the congestion in the weekly chart. Really you would need silver to dip below $14.80 to excite the bears. Any pull back will most likely be seen as a buying rather than a selling opportunity. If you don’t feel like chasing so to speak, give me a call we can look at options strategies.
Gold/Silver Ratio Daily Chart If you have any questions or would like to discuss the markets further, please feel free to contact me at 800-367-7290 or etesfaye@rjofutures.com. Energy - RBOB Gasoline and the Coronavirus
RBOB Gasoline and the Coronavirus
By: Frank J. Cholly, Senior Market StrategistPosted May 15, 2020 8:36AM CT
I am not at all surprised by the recent strength in the
gasoline futures market. In fact, I expected this type of market action as the
gasoline oversupply fundamental should quickly balance as the economy begins to
re-open and people will commute in their own automobiles and forego the trains
and planes. Recreational vehicles sales are off the chart as families want to
vacation with “social-distancing” and no hotels. People are just getting in
their cars and cruising around or driving out to the country. They’re also
likely to jump state lines into states that are fully open.
While we see the demand side fundamental increasing, it’s important to know that nearly 33% of refineries in the U.S. are still offline. We will likely see several large weekly draw downs in gasoline stocks over the next one to two months.
As the economy continues to re-open, and workers return to
work, how do you prefer to travel? I like the August RBOB contract which is
currently trading .9720 at the time of this writing. I don’t think that $1.50
is out of the question. Every penny is worth $420. Futures strategies are not
suitable for everyone, so I also have some limited risk option strategies if
you’re interested.
If you have any questions or would like to discuss the markets further, please feel free to contact me at 800-826-4124 or fcholly@rjofutures.com. Energy - Crude Concerns Continue
Crude Concerns Continue
By: Aleksandar CuricPosted 05/14/2020
While many risks remain in crude one of the main
macroeconomic fears moving forward towards a price recovery will be an early
increase in production before demand is fully restored. The next OPEC+ meeting
is just a couple weeks away, where members will discuss its production policy
going forward. The group will need to add to existing cuts to production and
cities will need to continue easing restrictions in order to see continued
bullish conditions. Stockpiles for the U.S. were down 745,000 barrels and the
EIA is now forecasting U.S. output to decline to 540,000 bpd. Futures traders
have moved positions into further out months in order to stay safely away from
any sort of volatility that we saw so extremely before.
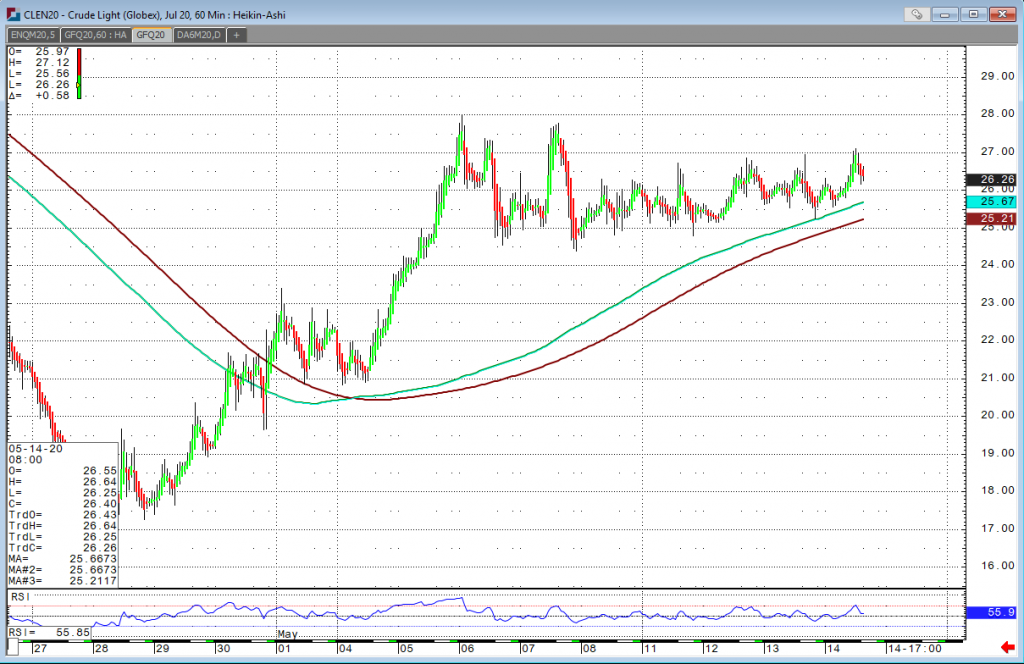
Looking at July crude we see what could be a positive signal for a short-term move. Support showing on the one hour chart at $26.00. We can see that if this level of support breaks a move to $25.21 level can happen quickly. July crude resistance starts at $26.50, which will need to brake in order to potentially see a test of $27.00 resistance. The next upside target remains at $27.50 on the contract.
Crude Oil Jul '20 Daily Chart
Softs - Cocoa Futures Remain Strong
Cocoa Futures Remain Strong
By: Eric ScolesPosted 05/13/2020
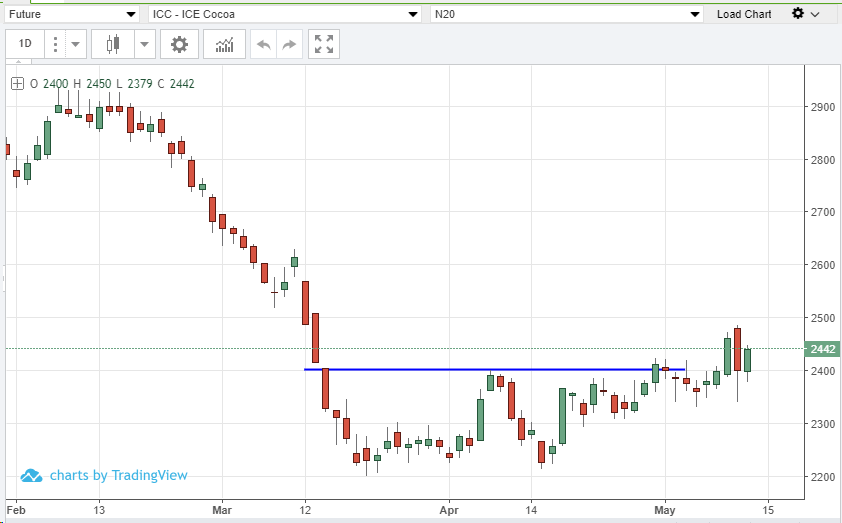
July ’20 cocoa futures regain much of yesterday’s losses being well supported by continued production concerns. Volatility is to be reasonably expected with this economically sensitive market as sentiment bounces back and forth between bullish and bearish attitudes about the re-opening of the global economy. The ongoing tensions between the US and China is a continued source of pressure. From a technical perspective yesterday’s sharp drop in price was rather bearish. However, the lows were rejected, and the market seems to have switched the 2400 price level from being resistance to a support point. I wouldn’t be surprised if we see some consolidation over the next few sessions as cocoa rebuilds some momentum before the next move. A close below 2400 would suggest a bearish tilt to the market until demand sentiment improves. A close above yesterday’s high would be a strong bullish indicator and could suggest on oncoming bull-run.
On
the heels of mid-Sep-to-early-Oct's steeper, accelerated, 3rd-wave-looking
recovery, the past week-and-a-half's boringly lateral chop is first considered
a corrective/consolidative event that warns of a continuation of the uptrend
that preceded it to new highs above 04-Oct's 891.0 high. This count
remains consistent with our broader base/correction/recovery count introduced
in 13-Sep's Technical Blog following that
day's bullish divergence in short-term momentum above 07-Sep's 809.5 minor
corrective high detailed in the hourly chart below.
The
important takeaway from this month's lateral, sleepy price action is the
definition of Wed's 851.5 low as
the end or lower boundary of a suspected 4th-Wave correction. A failure
below 851.5 will confirm a bearish divergence in daily momentum and defer or
threaten a bullish count enough to warrant non-bullish decisions like
long-covers. A failure below 851.5 will not
necessarily negate a broader bullish count, but it will threaten it enough to
warrant defensive measures as the next pertinent technical levels below 851.5 are
13-Sep's prospective minor 1st-Wave high at 813.8 and obviously 08-Sep's 766.0
low. And making non-bullish decisions "down there" is
sub-optimal to say the least. Per such, both short- and longer-term
commercial traders are advised to pare or neutralize bullish exposure on a
failure below 851.5, acknowledging and accepting whipsaw risk- back above 04-Oct's
891.0 high- in exchange for much deeper and sub-optimal nominal risk below
766.0.
On
a broader scale, the daily log scale chart above shows the developing potential
for a bearish divergence in daily momentum that will be considered confirmed
below 851.5. This chart also shows the past month's recovery thus far
stalling in the immediate neighborhood of the (888.0) Fibonacci
minimum 38.2% retrace of Apr-Sep's entire 1128 - 766 decline). COMBINED
with a failure below 851.5, traders
would then need to be concerned with at least a larger-degree correction pf the
past month's rally and possibly a resumption of Apr-Sep's major downtrend.
Until
and unless the market fails below 851.5 however, we would
remind longer-term players of the key elements on which our bullish count is
predicated:
a confirmed bullish divergence in WEEKLY momentum
(below)
amidst
an
historically low 11% reading in out RJO Bullish Sentiment Index and
a
textbook complete and major 5-wave Elliott sequence down from 29-Apr's
1128 high to 08-Sep's 766.0 low.
Thus
far, the market is only a month into correcting a 4-MONTH, 32% drawdown, so
further and possibly protracted gains remain well within the bounds of a major
(suspected 2nd-Wave) correction of Apr-Sep's decline within an even more
massive PEAK/reversal process from 17-May's 1219 high on an active continuation
basis below.
These
issues considered, a bullish policy and exposure remain advised with a failure
below 851.5 required to defer or threaten this call enough to warrant moving to
a neutral/sideline position. In lieu of such weakness, we anticipate a
continuation of the past month's rally to new highs and potentially significant
gains above 891.0.
Agricultural - Grain Futures Update w/Stephen Davis - 05/15/2020
Grain Futures Update w/Stephen Davis - 05/15/2020
By: Stephen DavisPosted 05/15/2020
The USDA report came out this week and the readings were unsurprisingly bearish. Keep an eye on the big report which is the Acreage report due out at the end of June.
Agricultural - Live Cattle: U.S. Beef Production Down
Live Cattle: U.S. Beef Production Down
By: Peter McGinnPosted 05/13/2020
June cattle futures finished limit
up yesterday which was its highest close since March 11th of this
year. There is some good support coming from the discount of the futures to the
cash market even as cash continued to rally this week and last. Traders are
expecting the slaughter numbers to continue to increase this week while U.S.
beef production expected to decline in the 2nd quarter. The USDA
boxed beef cutout was up $7.10 at mid-session yesterday and closed $6.81 higher
at $475.39. This was up from $428.99 the previous week and was another new
all-time high. The cutout has increased for 24 straight sessions. It has
increased $253.05 (+114%) since April 8. In their monthly supply/demand report,
the USDA lowered 2020 beef production to 25.830 billion pounds, down 6.1% from
the April estimate. Poultry production was revised down 2.8% and pork down
5.5%. Second quarter production was lowered by 1.255 billion from the April
report, 3rd quarter by 375 million and 4th quarter by 55 million. The USDA
estimated cattle slaughter came in at 89,000 head yesterday. This brings the
total for the week so far to 175,000 head, up from 155,000 last week, but down
from 241,000 a year ago. Cash live cattle were a bit softer on Tuesday. In
Kansas, 2,370 head traded at $110, down from $104-$115 and an average price of
$110.60 on Friday. In Nebraska, 940 head traded at $105-$110 and an average
price of $109.12, down from $114.01 on Monday but up from $108.82 on Friday. In
Texas/Oklahoma, 246 traded at $100, steady with Monday but down from $105 on
Friday.
The story of the cattle market is still the supply side news whether it’s about decreased production for the quarter or increased slaughter numbers making packers continue the current pace. The cross over and close above the 60-day moving average is an indication the longer-term trend has turned positive. A positive signal for trend short-term was given on a close over the 9-bar moving average. Market positioning is positive with the close over the 1st swing resistance. The near-term upside objective is at 100.170. The market is becoming somewhat overbought now that the RSI is over 70. The next area of resistance is around 99.170 and 100.170, while 1st support hits today at 95.170 and below there at 92.150.
Live Cattle Jun "20 Daily ChartEquity - Stocks Fall After Record Drop in Retail Sales
Stocks Fall After Record Drop in Retail Sales
By: Jeff Yasak, Senior Market StrategistPosted May 15, 2020 9:36AM CT
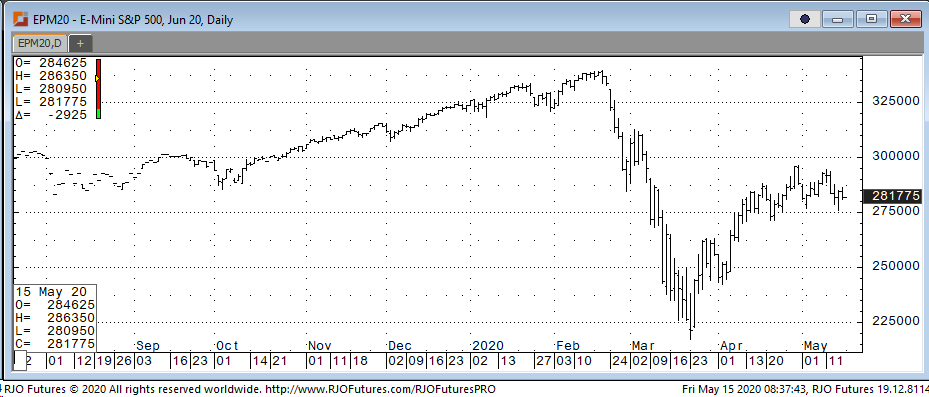
U.S. stock futures fell this morning on increased trading tensions with China and a record drop in retail sales. As the coronavirus continued to keep people at home and businesses shuttered, the U.S. Commerce Department released the record breaking drop in retail sales. With an anticipated 11.2% decline the actual number of 16.4% in April was the largest since 1992 when record-keeping was started. Sales numbers in March showed an 8.3% decline. Clothing was down an incredible 78.8%, a drop of 89% year to year, electronics 61% and gasoline almost 30%. Amazon was the only bright spot with an 8.4% increase. The U.S.-China trade relationship took a major step back As President Trump said he had no interest speaking to his Chinese counterpart and completely cutting ties with them remains on the table. “They should have never let this happen”, Trump said, “So I make a great trade deal and now I say this doesn’t feel the same to me. The ink was barely dry and the plague came over. And it doesn’t feel the same to me.”
Support today is 282200 and 274500 with resistance showing 291500 and again at 293000.
E-mini S&P 500 Jun '20 Daily Chart If you have any questions or would like to discuss the markets further, please feel free to contact me at 888-861-1656 or jyasak@rjofutures.com. Economy - S-T Mo Failure Insufficient to End RBOB Correction, But Beware
S-T Mo Failure Insufficient to End RBOB Correction, But Beware
By: RJO Market InsightsPosted 11/08/2022
Posted on Nov 08, 2022, 07:51 by Dave Toth
In Fri's Technical Webcast we identified a
minor corrective low at 2.6328 from Thur as a mini risk parameter the market
needed to sustain gains above to maintain a more immediate bullish count.
The 240-min chart below shows the market's failure overnight below this level,
confirming a bearish divergence in very short-term momentum. This mo
failure defines Fri's 2.8172 high as
one of developing importance and a parameter from which very short-term traders
can objectively base non-bullish decisions like long-covers.
Given
the magnitude of the past three weeks' broader recovery however, this
short-term momentum failure is of an insufficient scale to conclude anything
more than another correction within this broader recovery from 26-Sep's 2.1877
low. Indeed, overnights failure below 2.6328 only allows us to conclude
the end of the portion of the month-and-a-half rally from 31-Oct's 2.4822 next
larger-degree corrective low. 2.4822 is the
risk parameter this market still needs to fail below to break the uptrend from
18-Oct's 2.3526 low while this 2.3526 low
remains intact as the risk parameter this market needs to fail below to break
the month-and-a-half uptrend. From an
intermediate-to-longer-term perspective, this week's setback falls well within
the bounds of another correction ahead of further gains. This is another
excellent example of the importance of technical and trading SCALE and
understanding and matching directional risk exposure to one's personal risk
profile.
The
reason overnight's admittedly minor mo failure might have longer-term
importance is the 2.8172-area from which it stemmed. In
Fri's Technical Blog we also noted the market's engagement of the
2.8076-to-2.8159-area marked by the 61.8% retrace of Jun0-Sewp's 3.2758 -2.1877
decline and the 1.000 progression of Sep-Oct's initial 2.1877 - 2.6185
(suspected a-Wave) rally from 18-Oct's 2.3526 (suspected b-Wave) low. We
remind longer-term players that because of the unique and compelling confluence
of:
early-Aug's bearish divergence in WEEKLY momentum
amidst
historically
extreme bullish sentiment/contrary opinion levels in our RJO Bullish
Sentiment Index
an
arguably complete and massive 5-wave Elliott sequence from Mar'20's 0.4605
low to Jun's 4.3260 high (as labeled in the weekly log active-continuation
chart below) and
the
5-wave impulsive sub-division of Jun-Sep's (suspected initial 1st-Wave) decline
The
recovery attempt from 26-Sep's 2.1877 low is arguably only a 3-wave (Wave-2)
corrective rebuttal to Jun-Sep's decline within a massive, multi-quarter
PEAK/reversal process. Now granted, due to the magnitude of 2020 -2022's
secular bull market, we discussed the prospect for this (2nd-Wave corrective)
recovery to be "extensive" in terms of both price and time. A
"more extensive" correction is typified by a retracement of 61.8% or
more and spanning weeks or even months following a 3-month decline. Per
such, the (suspected corrective) recovery from 26-Sep's 2.1877 low could easily
have further to go, with commensurately larger-degree weakness than that
exhibited this week (i.e., a failure below at least 2.4822) required
to consider the correction complete. Indeed, the daily log chart above
shows the market thus far respecting former 2.6185-area resistance from 10-Oct
as a new support candidate.
These
issues considered, very shorter-term traders have been advised to move to a neutral/sideline
position following overnight's momentum failure below 2.6328, with a recovery
above 2.8172 required to negate this call, reaffirm the recovery and re-expose
potentially significant gains thereafter. For intermediate- and
longer-term players, a bullish policy and exposure remain advised with a
failure below 2.4822 required to threaten this call enough to warrant
neutralizing exposure. We will be watchful for another bearish divergence
in momentum following a recovery attempt that falls short of Fri's 2.8172 high
that would be considered the next reinforcing factor to a count calling that
2.8172 high the prospective end to the month-and-a-half 2nd-Wave
correction. In lieu of such, a resumption of the current rally to
eventual new highs above 2.8172 should not surprise.