Experience a trading platform like no other with integrated tools to seamlessly trade and monitor the markets. With a free simulated trading account and personal broker experience, we’ll teach you about futures trading and help you develop a trading strategy.
The Markets
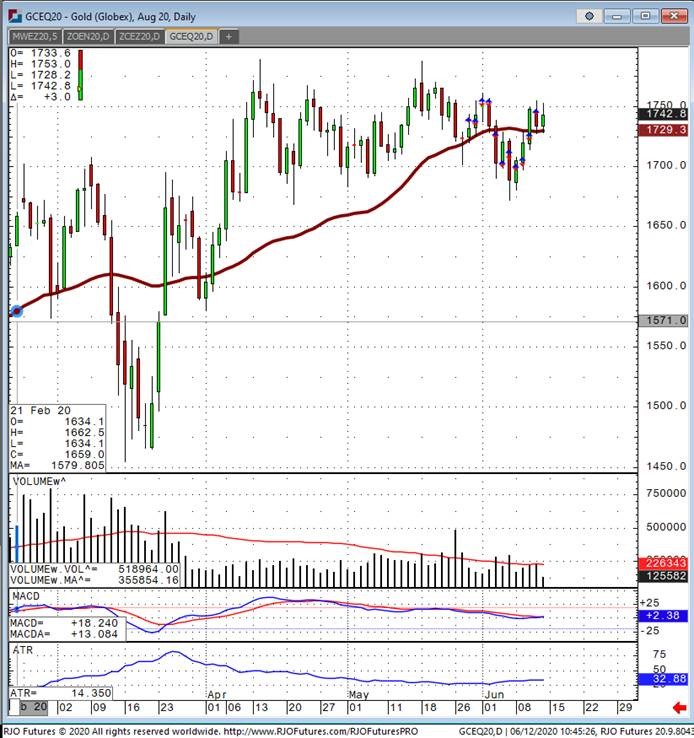
Metals - Gold Hangs On, Remains Choppy
Gold Hangs On, Remains Choppy
By: Joshua GravesPosted 06/12/2020
August gold futures have seen once again, a fair bit of
volatility and remains in a sideways pattern despite the washout from last
Friday. In recent articles I’ve states my thoughts on this market, and I
continue to say forget about the noise that comes out every day about what’s
bullish and what’s bearish and look at the technical at this point. The most
important level to watch in gold right now from a technical perspective is the
recent all time high, which on August futures is 1789 back on April 14th.
The gold market seems to be a buy on a dip to 1680 to 1685 and a sell around
1750 to 1760. I think that the same themes for talking about why be bullish and
why be bearish in gold have been talked about endlessly. The only interesting
bullish theme has been central bank buying as support, and seemingly endless
weekly inflow of physical gold into the etf holdings that do provide bullish
support with increased physical demand.
There are ways to trade gold right now and everything wants to know the best risk/reward setup. Unfortunately, there isn’t a “risk free” perfect trade out there. With a market like gold you need to accept the fact that the average trading range on gold futures right now is $33. On a 100oz contract, that is $3300, while a mini 50oz contract is half of this. Options are a great way to hedge a futures position with unlimited profit potential and limited risk. The other trade I would recommend involves options and plays gold to a neutral market outlook, that has limited risk and limited reward, and in a fairly short time frame under 30 days.
Gold Aug '20 Daily ChartMetals - Don't Expect Silver to Rally Soon
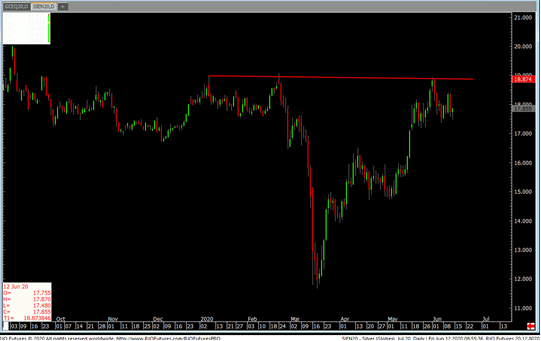
Don't Expect Silver to Rally Soon
By: Eli Tesfaye, Senior Market StrategistPosted Jun 12, 2020 9:48AM CT
Front month's July silver is down about 7 cents to 17.82. From a technical prospective, anyone looking at the daily chart below has to wonder if silver is poised for a big move to the upside. The fundamentals continue to favor bulls and subsequent drive to the upside. From supportive Fed actions that seems to give the bulls reasons to be confident to attempt to push price higher. I still think that we won't see a sharp rally in silver as one might expect due to what I consider a deflationary backdrop of the economy that is filled with a lot of uncertainty as opens rather slowly in this post 19-covid- global society.
Again, From technical prospective, the daily chart in silver is looking to continue to make new highs. In my view, Silver will see 20.00 dollar before it sees 15.00. In other words, the drive will likely have silver go higher before any major corrective price action.
I have some ideas on how to use options to trade these environment, if you not inclined to buy into 4 weeks high futures prices. Reach out to me to discuses silver in general. Happy trading.
Silver Jul '20 Daily Chart If you have any questions or would like to discuss the markets further, please feel free to contact me at 800-367-7290 or etesfaye@rjofutures.com. Energy - Crude Shows Weakness
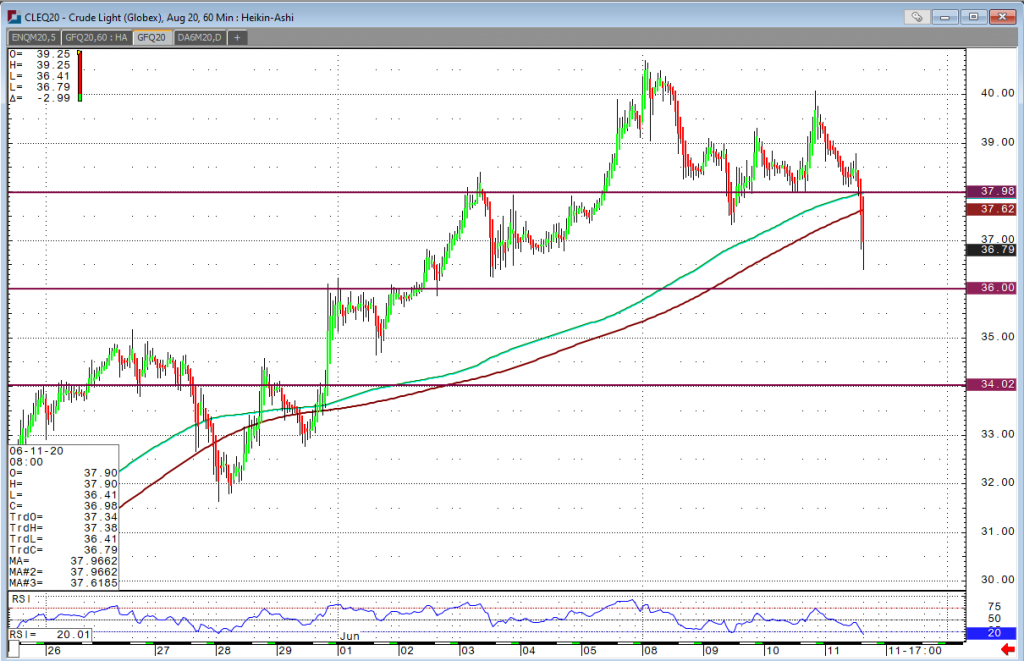
Crude Shows Weakness
By: Aleksandar CuricPosted 06/11/2020
After OPEC’s last weekend decision to extend its production
cut, the spotlight returned to the demand story. The risk of a second wave of
infections that could bring countries back into a strict lockdown remains a
worry. Crude inventories rose by nearly 5.7 million barrels, EIA data showed.
The sustained return in demand will be key in bringing back a rebalancing in
the market. The crude market as a result of the increases in inventories will
face a large overhang and a long path to reverse the inventory build while the
global economic activity remains depressed.
August crude looks to be taking a leg lower from some the relative overbought levels is pointing to a bearish signal. The August’s contracts inability to hold $37 dollar level should prove to be a weak point. The contract break of this level should accelerate a move to the $36 dollar level of support. If we can see some support here we may be able to test the $37 and $38 dollar level of resistance.
Crude Oil Aug '20 Daily ChartSofts - Cocoa Charts Offer a Bullish Pattern
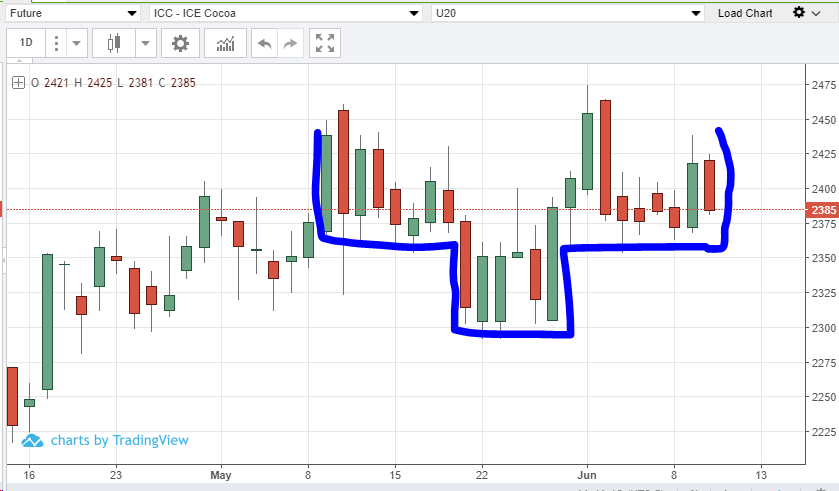
Cocoa Charts Offer a Bullish Pattern
By: Eric ScolesPosted 06/11/2020
September ’20 cocoa futures price fell by 1.41 during yesterday’s session (6/10/20) which must be disappointing to the bulls with so much potential for a rally. The story of ongoing issues related to excessive hot and dry weather in major growing regions reinforces the chances of lower production this season. This is an important factor in supporting current price levels while grinding higher. What has prevented this market from taking off to the upside has been global demand concerns. However, it seems as if the Eurozone has maintained strong demand even through the pandemic, and Asian prospects seems strong as well. With increasing economic stability in the major purchasing regions, there is a lot of upside price potential for a commodity struggling with poor growing conditions. From a technical perspective even with today’s move down in prices, the chart looks bullish. We have what could be a clear reverse head-and-shoulders pattern on the charts which may indicate rising prices ahead.
On
the heels of mid-Sep-to-early-Oct's steeper, accelerated, 3rd-wave-looking
recovery, the past week-and-a-half's boringly lateral chop is first considered
a corrective/consolidative event that warns of a continuation of the uptrend
that preceded it to new highs above 04-Oct's 891.0 high. This count
remains consistent with our broader base/correction/recovery count introduced
in 13-Sep's Technical Blog following that
day's bullish divergence in short-term momentum above 07-Sep's 809.5 minor
corrective high detailed in the hourly chart below.
The
important takeaway from this month's lateral, sleepy price action is the
definition of Wed's 851.5 low as
the end or lower boundary of a suspected 4th-Wave correction. A failure
below 851.5 will confirm a bearish divergence in daily momentum and defer or
threaten a bullish count enough to warrant non-bullish decisions like
long-covers. A failure below 851.5 will not
necessarily negate a broader bullish count, but it will threaten it enough to
warrant defensive measures as the next pertinent technical levels below 851.5 are
13-Sep's prospective minor 1st-Wave high at 813.8 and obviously 08-Sep's 766.0
low. And making non-bullish decisions "down there" is
sub-optimal to say the least. Per such, both short- and longer-term
commercial traders are advised to pare or neutralize bullish exposure on a
failure below 851.5, acknowledging and accepting whipsaw risk- back above 04-Oct's
891.0 high- in exchange for much deeper and sub-optimal nominal risk below
766.0.
On
a broader scale, the daily log scale chart above shows the developing potential
for a bearish divergence in daily momentum that will be considered confirmed
below 851.5. This chart also shows the past month's recovery thus far
stalling in the immediate neighborhood of the (888.0) Fibonacci
minimum 38.2% retrace of Apr-Sep's entire 1128 - 766 decline). COMBINED
with a failure below 851.5, traders
would then need to be concerned with at least a larger-degree correction pf the
past month's rally and possibly a resumption of Apr-Sep's major downtrend.
Until
and unless the market fails below 851.5 however, we would
remind longer-term players of the key elements on which our bullish count is
predicated:
a confirmed bullish divergence in WEEKLY momentum
(below)
amidst
an
historically low 11% reading in out RJO Bullish Sentiment Index and
a
textbook complete and major 5-wave Elliott sequence down from 29-Apr's
1128 high to 08-Sep's 766.0 low.
Thus
far, the market is only a month into correcting a 4-MONTH, 32% drawdown, so
further and possibly protracted gains remain well within the bounds of a major
(suspected 2nd-Wave) correction of Apr-Sep's decline within an even more
massive PEAK/reversal process from 17-May's 1219 high on an active continuation
basis below.
These
issues considered, a bullish policy and exposure remain advised with a failure
below 851.5 required to defer or threaten this call enough to warrant moving to
a neutral/sideline position. In lieu of such weakness, we anticipate a
continuation of the past month's rally to new highs and potentially significant
gains above 891.0.
Agricultural - Grain Futures Update w/Stephen Davis - 06/12/2020
Grain Futures Update w/Stephen Davis - 06/12/2020
By: Stephen DavisPosted 06/12/2020
Stephen Davis discusses this week's movements in the grain markets. The stock markets took a loss this week, but that shouldnt scare traders off commodities. China is still buying a lot of U.S. commodities like soy and pork.Agricultural - Live Cattle Showing Positive Support
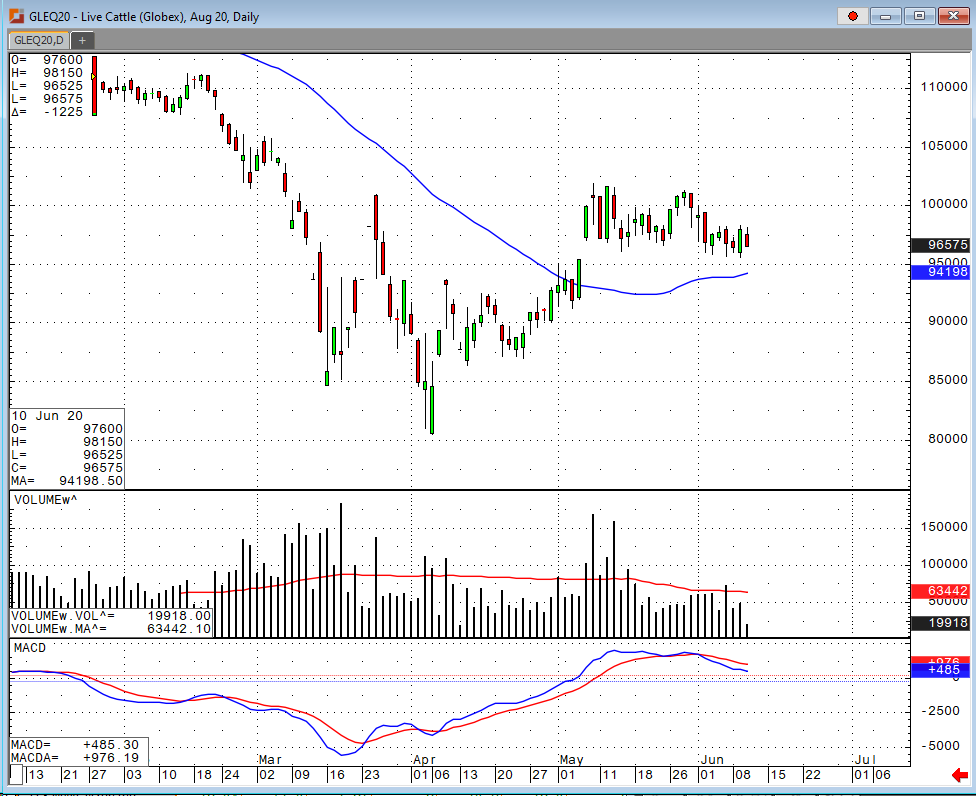
Live Cattle Showing Positive Support
By: Peter McGinnPosted 06/10/2020
August cattle traded at its lowest point since May 6th
but eventually closed higher on the day. Though it failed to fill the gap that
was made on May 7th, the market is still showing some positive
technical support. The trend in the cash market and box beef prices have been
trending lower over the past few trading sessions but it appears that the
futures market has already priced in this cash market move. The USDA boxed beef
cutout was down $5.29 at mid-session yesterday and closed $7.58 lower at
$247.00. This was down from $318.73 the previous week and was the lowest the
cutout had been since April 17.
The cutout's decline has been precipitous, from a peak of $475.39 on May 12. It has fallen for 18 straight sessions, but it is still higher than it was at this time in 2019 or 2018. Cash live cattle traded lower in very limited volume on Tuesday. In Iowa/Minnesota 186 head traded at $106 versus an average price of $108.44 late last week, and in Nebraska 160 head traded at $104 versus an average price $111.99 on Friday. It is starting to become a little clearer that the cash market is going to the one that takes the most heat over the next couple of days, June traded higher during yesterday’s session but traders are now starting to roll over into the August contract so the spread between the cash and futures is still pretty wide. With daily slaughter rates nearing year-ago levels, and approaching 120,000 per day, less and less focus will be put on supply disruption as the attention moves back to end user demand. The USDA estimated cattle slaughter came in at 117,000 head yesterday. This brings the total for the week so far to 234,000 head, up from 226,000 last week, but down from 241,000 a year ago.
Live Cattle Aug '20 Daily ChartCurrency - Yen Rockets as Virus Pessimism Recedes
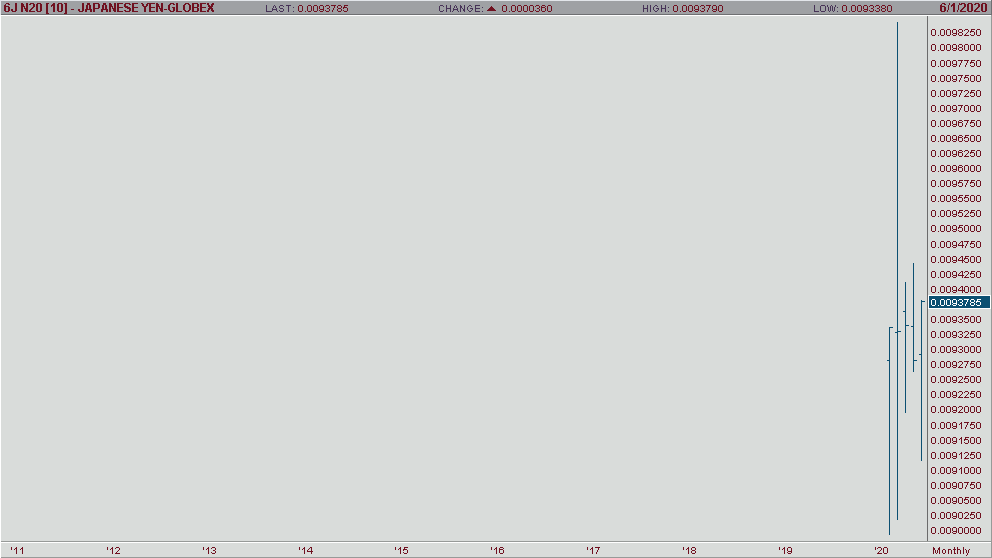
Yen Rockets as Virus Pessimism Recedes
By: Steve SylasPosted 06/11/2020
The yen has reached its highest point since May based on several news factors that have driven Asian market optimism. As OPEC agreed to output cuts on Saturday, June 6th, and U.S. jobless claims came out better than expected, the Asian markets began to see new life. The Nikkei 225 rose 1.2% on the seventh, pulling the yen along with it as the world economy was perceived to have new life. The yen has continued to rage on all the way through the eleventh, but will it continue? My analysis says it will into the foreseeable future. As U.S. policymakers have given a more pessimistic outlook on the pandemic recently, a slight pullback only seems natural; however, I still see yen future prices rising at an exponential level on the one-year-one-day chart. Considering this on top of U.S. equities erasing almost all losses incurred from the pandemic, optimism seems to be in great supply. There may be a few bumps in the road along the way, but I am long on the yen into the next 1-2 weeks.
Yen Jul '20 Daily Chart
Equity - Stocks: All is Well? Not so Fast
Stocks: All is Well? Not so Fast
By: Jeff Yasak, Senior Market StrategistPosted Jun 12, 2020 8:25AM CT
Stock futures rallied this morning gaining back
some of the gains lost on Thursday, the worst trading day on Wall Street since
mid-March. Thursdays down day, a 7%
decline in the Dow, was triggered by increased coronavirus cases around the
country and warnings of sustained economic losses caused by the virus
shutdowns. The losses came after John Hopkins University released data that
showed new coronavirus cases were rising in a handful of states, cases in
Arizona have almost doubled since Memorial Day. Even with the huge drop
Thursday the market was still 35% above the intraday lows seen on March 23rd.
These gains were fueled by industries that would greatly benefit from an
economic reopening such as retailers, airlines and vacation-based companies.
“We had gone straight up more than
30% without a real sell-off, so you’re due for one, and I don’t think it’s the
worst thing in the world,” said JJ Kinahan, chief market strategist at TD
Ameritrade. “As more states get back, the question becomes: Are they going to
ramp up fast enough to please Wall Street? What you’re seeing is it’ll be hard
to do that. Some of these stocks may have gotten ahead of their skis. When you
see some of the airlines being priced at the levels they were before this all
started when they say they’re going to do 60% of their business just doesn’t
make sense.”
Support is checking in today at 252500 and 229500 while resistance is showing 284000 and 293000.
E-mini S&P 500 Sep '20 Daily Chart If you have any questions or would like to discuss the markets further, please feel free to contact me at 888-861-1656 or jyasak@rjofutures.com. Economy - S-T Mo Failure Insufficient to End RBOB Correction, But Beware
S-T Mo Failure Insufficient to End RBOB Correction, But Beware
By: RJO Market InsightsPosted 11/08/2022
Posted on Nov 08, 2022, 07:51 by Dave Toth
In Fri's Technical Webcast we identified a
minor corrective low at 2.6328 from Thur as a mini risk parameter the market
needed to sustain gains above to maintain a more immediate bullish count.
The 240-min chart below shows the market's failure overnight below this level,
confirming a bearish divergence in very short-term momentum. This mo
failure defines Fri's 2.8172 high as
one of developing importance and a parameter from which very short-term traders
can objectively base non-bullish decisions like long-covers.
Given
the magnitude of the past three weeks' broader recovery however, this
short-term momentum failure is of an insufficient scale to conclude anything
more than another correction within this broader recovery from 26-Sep's 2.1877
low. Indeed, overnights failure below 2.6328 only allows us to conclude
the end of the portion of the month-and-a-half rally from 31-Oct's 2.4822 next
larger-degree corrective low. 2.4822 is the
risk parameter this market still needs to fail below to break the uptrend from
18-Oct's 2.3526 low while this 2.3526 low
remains intact as the risk parameter this market needs to fail below to break
the month-and-a-half uptrend. From an
intermediate-to-longer-term perspective, this week's setback falls well within
the bounds of another correction ahead of further gains. This is another
excellent example of the importance of technical and trading SCALE and
understanding and matching directional risk exposure to one's personal risk
profile.
The
reason overnight's admittedly minor mo failure might have longer-term
importance is the 2.8172-area from which it stemmed. In
Fri's Technical Blog we also noted the market's engagement of the
2.8076-to-2.8159-area marked by the 61.8% retrace of Jun0-Sewp's 3.2758 -2.1877
decline and the 1.000 progression of Sep-Oct's initial 2.1877 - 2.6185
(suspected a-Wave) rally from 18-Oct's 2.3526 (suspected b-Wave) low. We
remind longer-term players that because of the unique and compelling confluence
of:
early-Aug's bearish divergence in WEEKLY momentum
amidst
historically
extreme bullish sentiment/contrary opinion levels in our RJO Bullish
Sentiment Index
an
arguably complete and massive 5-wave Elliott sequence from Mar'20's 0.4605
low to Jun's 4.3260 high (as labeled in the weekly log active-continuation
chart below) and
the
5-wave impulsive sub-division of Jun-Sep's (suspected initial 1st-Wave) decline
The
recovery attempt from 26-Sep's 2.1877 low is arguably only a 3-wave (Wave-2)
corrective rebuttal to Jun-Sep's decline within a massive, multi-quarter
PEAK/reversal process. Now granted, due to the magnitude of 2020 -2022's
secular bull market, we discussed the prospect for this (2nd-Wave corrective)
recovery to be "extensive" in terms of both price and time. A
"more extensive" correction is typified by a retracement of 61.8% or
more and spanning weeks or even months following a 3-month decline. Per
such, the (suspected corrective) recovery from 26-Sep's 2.1877 low could easily
have further to go, with commensurately larger-degree weakness than that
exhibited this week (i.e., a failure below at least 2.4822) required
to consider the correction complete. Indeed, the daily log chart above
shows the market thus far respecting former 2.6185-area resistance from 10-Oct
as a new support candidate.
These
issues considered, very shorter-term traders have been advised to move to a neutral/sideline
position following overnight's momentum failure below 2.6328, with a recovery
above 2.8172 required to negate this call, reaffirm the recovery and re-expose
potentially significant gains thereafter. For intermediate- and
longer-term players, a bullish policy and exposure remain advised with a
failure below 2.4822 required to threaten this call enough to warrant
neutralizing exposure. We will be watchful for another bearish divergence
in momentum following a recovery attempt that falls short of Fri's 2.8172 high
that would be considered the next reinforcing factor to a count calling that
2.8172 high the prospective end to the month-and-a-half 2nd-Wave
correction. In lieu of such, a resumption of the current rally to
eventual new highs above 2.8172 should not surprise.
Economy - Random Acts of Volatility
Random Acts of Volatility
By: John Caruso, Senior Market StrategistPosted Jun 12, 2020 9:01AM CT
Well look at that. We went from a nice comfortable 2-month “melt up” in stocks, to now back to managing a market with a volatility index north of 40 yesterday! That’s the non-linearity of this game – there’s no predetermined path for markets, no matter how much the Fed can make the printing press go Brrrrrr. Until the fundamentals of the cornerstone of this market, that being Corporate Profits and Earnings improves, expect these pitfalls and random episodes of volatility to continue. Volatility clusters and can be completely random, and fractal.
Russell 2000- we essentially called the top in U.S. Small Caps. We caught it for 30-40 pts and took the money, what are you gonna do? Yeah I know it could’ve been “juicier” but I’m not here to tell you that I know exactly what’s going to happen in markets from on minute to the next. What I do is map the cycle and play the probabilities within the context of our trading process and model.
Commodities- We were net sellers/bears of commodities in Q1 and Q2. We’re buyers of the commodity space headed into Q3 2020. We’re agnostic about markets, and we always position alongside our Growth/Inflation model. Stagflation is the call in Q3. A broader reacceleration in inflation, and continued slow growth y/y. That’s our call headed into the back half of the year. Stay tuned for more here. I will say we may be looking at the Bloomberg Commodity Index again, a market that worked well for us at the backend of 2019.
Yields- smashed from the top end of the range on yesterday’s stock market crash. This may be the #1 “don’t fight the Fed” market. Yield curve control is now being discussed by the Fed as a policy tool – we’ll likely continue to signal for bonds at the low end of the range in price/top end of the range in yields.
If you have any questions or would like to discuss the markets further, please feel free to contact me at 800-669-5354 or jcaruso@rjofutures.com.