Orion Multi-Trader is a high-performance, multi-asset, broker-neutral platform for sophisticated investors. A powerful analysis and trading tools that enables you to design, execute and manage automated order strategies with ease.
Easy order management directly from Charts, Price Ladder or Quotes
Technical indicators with Orion MT’s advanced charts
Design, execute and manage automated order strategies with ease
Simulated trading environment
The Markets
Metals - Will Gold Trade to $1,600?
Will Gold Trade to $1,600?
By: Nicholas DeGeorgePosted 09/20/2019
In the early morning trade, December gold is trading
slightly up at $1,510 an ounce. Gold continues to hold onto the $1,500 an ounce
handle and with a light U.S. economic report slated for today, the shiny one
should be able to end the week above it. December gold should enjoy continued
support from weakness in the US dollar and the ongoing tensions in the Middle
East with Iran. Furthermore, the bull camp gained more support with the
overnight Saudi attacks on parts of Yemen, which claimed responsibility for the
attacks over last weekend on Saudi Arabia’s oil production.
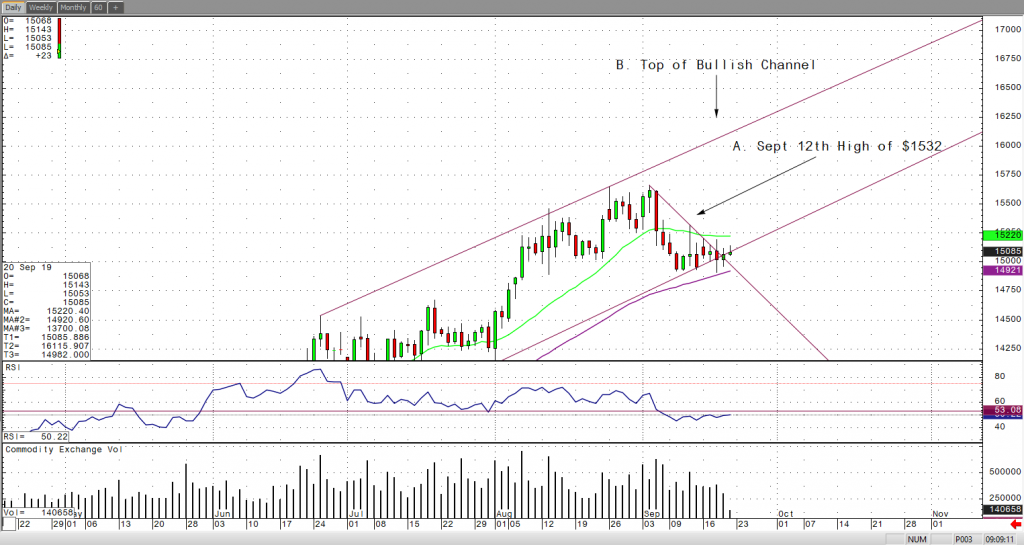
If we take a quick look at the daily December gold chart, you’ll clearly see that gold is still holding onto its strong up trend and still trading in its bullish up trending channel as well. If gold can trade and hold above last week high of $1,532, then gold is prone to test the top of the channel which is well above $1,600 an ounce at this time. I have highlighted these levels below on my RJO Pro daily December gold chart.
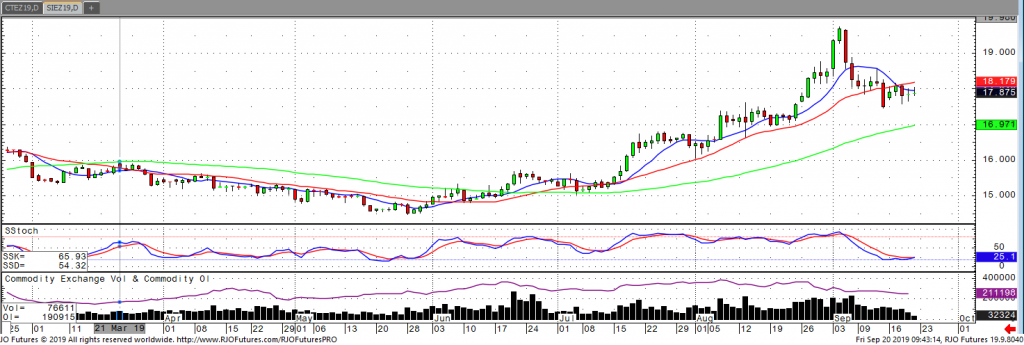
The silver market saw choppy sideways trade this week after
last Friday’s slide lower to 17.505 in the December contract. Despite the Saudi
oil attack over the weekend and FOMC meeting on Wednesday the silver market
continues to consolidate at this support level. Mixed global equity markets
overnight show no real push one way or the other but continued Chinese support
of their economy and India’s corporate tax rate reductions could lend some
support.
We will also see U.S. Fed speeches today, but a slowing of U.S. economic data reports could curtail any breakout mores. Thursday’s push higher in the stock market added pressure to silver and other metals as it weakens the safe-haven demand of metals. Any escalation of tensions in the middle east or signs of global economic slowdown would give bulls support to push the market off this support. In the December contract a close over 18.10 is needed to continue the trend higher and with momentum levels approaching oversold levels any bullish fundamental news could trigger a short covering rally that would accelerate a move higher.
If you have any questions or would like to discuss the markets further, please feel free to contact me at 800-826-2270 or therrmann@rjofutures.com. Energy - Questions Remain Following Wild Week in Crude
Questions Remain Following Wild Week in Crude
By: Michael O'DonnellPosted 09/19/2019
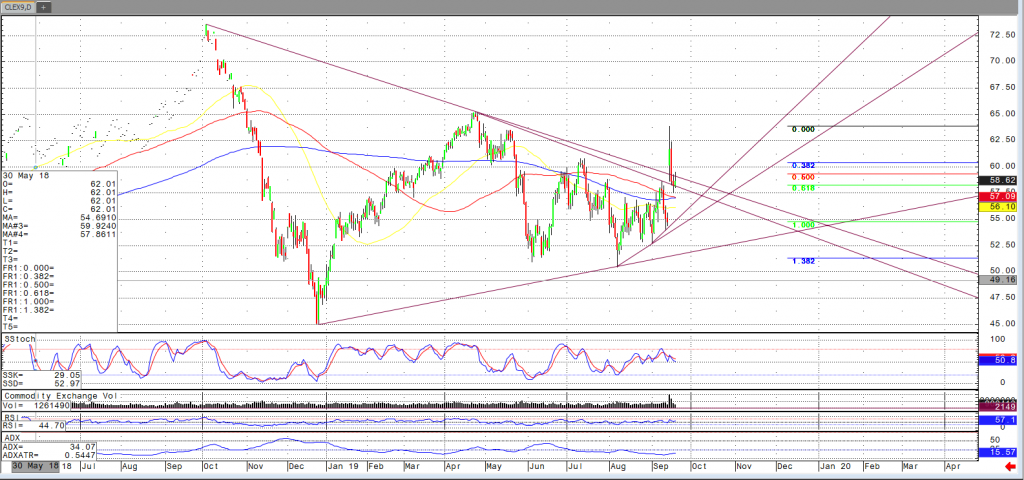
Following the weekend’s developments, namely, the bombing of
Saudi oil facilities, with responsibility claimed by Houthi rebels and finger
pointing at Iran; the now front month November contract gapped $9.10 from
Friday the 13th’s close to the high Sunday night – Monday
morning. While the market has somewhat
settled down, it remains without the gap closed and above the broken upper
trendline from the October 2018 and 2019 highs (pictured below).
While the U.S. now trumps Saudi Arabia in production, there
are reports of 70+ million barrels of Saudi storage, the global oil market is
more diversified than in the past. There are reports of capacity coming back
online, but there remains the concern for escalation should there be military
conflict in the region.
While these fundamental developments are being monitored,
several technical questions also remain.
For instance, the gap remains unclosed, former trendline resistance is
acting as support and the Fibonacci levels from the Friday close to Monday
morning-overnight high remain.
Movements such as this often have the potential to create opportunity in the market. To discuss your trading in this market and others, please contact me at your convenience.
Softs - Cocoa Futures Continue to Climb
Cocoa Futures Continue to Climb
By: Peter MoosesPosted 09/19/2019
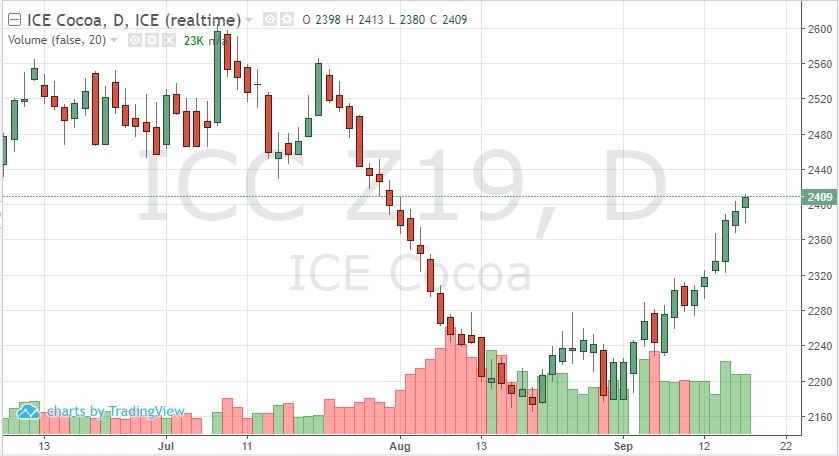
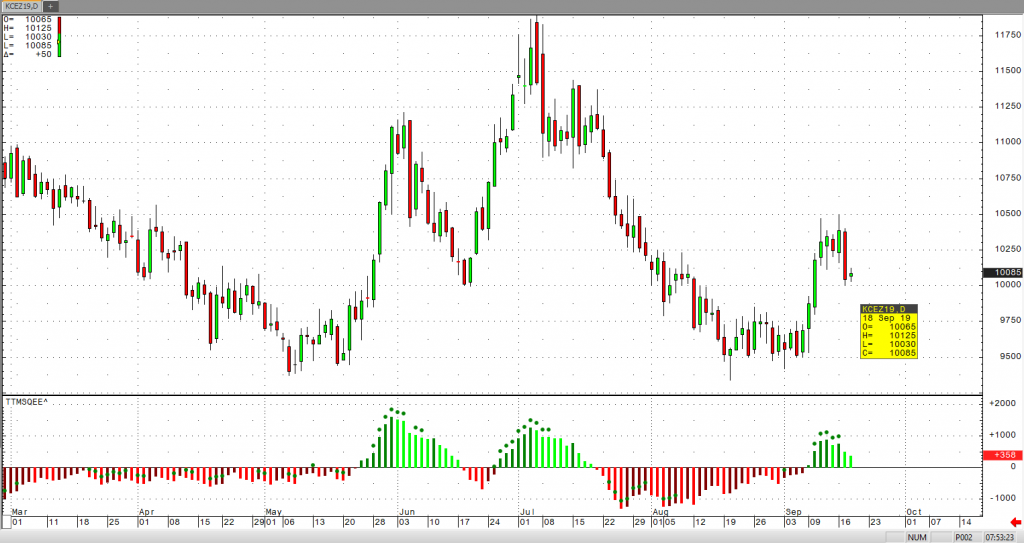
It appears the lows may have been put in the December cocoa
futures contracts. Although the contract has hit overbought levels, the
technicals and fundamentals are working together to get prices back to 2500. As
the panic in the global markets has taken a short breather, cocoa futures have
put together six positive sessions. Technically, prices continue to close above
the 9-day moving average. A long-term bullish technical signal was also reached
with a close above the 200-day moving average. Unfortunately, any disruption in
the global equities creates pullbacks in the softs’ prices – but those
pullbacks have created buying opportunities.
Traders appear to be adding to positions as futures’ prices climb, taking a more conservative approach after the decline in prices during July/August. The euro and pound will add to the support and this move higher as these currencies have moved with market conditions and risk sentiment. Supply and demand have taken a backseat currently and many traders are looking outside the fundamentals. Resistance is around 2445 then at 2495. Positive economic news alongside more longs entering the market will be needed to test contract highs as we enter the final quarter of the year. COT data after the close Friday will gives us a feel for how traders are positioning.
Softs - Coffee Short Covering Rally
Coffee Short Covering Rally
By: Adam TuiaanaPosted 09/18/2019
Next week’s weather forecast for major growing
areas in Brazil are showing quite favorable, which really helps to keep
rallying December coffee prices in check. The recent strength in December
coffee can be primarily attributed to dry conditions last year, and as our
friends at The Hightower Group previously reported, “while next week’s rainfall should benefit Brazil’s upcoming 2020/21
production, it will not offset several months of dry conditions and July’s
frost event”.
Recently, among ongoing tariff talks and new issues
arising with Iran and the Saudi oil fields, we’re seeing more of a “risk-off”
trade, with money camping out more on the sidelines of some safe-haven
commodities and the U.S. dollar.
The December coffee price action yesterday showed some strong short-covering, but I believe that December coffee prices will need to see positive news in the way of resolved issues with Iran, and a weaker USD to offer the support needed to recover and revisit the 10750 level.
On
the heels of mid-Sep-to-early-Oct's steeper, accelerated, 3rd-wave-looking
recovery, the past week-and-a-half's boringly lateral chop is first considered
a corrective/consolidative event that warns of a continuation of the uptrend
that preceded it to new highs above 04-Oct's 891.0 high. This count
remains consistent with our broader base/correction/recovery count introduced
in 13-Sep's Technical Blog following that
day's bullish divergence in short-term momentum above 07-Sep's 809.5 minor
corrective high detailed in the hourly chart below.
The
important takeaway from this month's lateral, sleepy price action is the
definition of Wed's 851.5 low as
the end or lower boundary of a suspected 4th-Wave correction. A failure
below 851.5 will confirm a bearish divergence in daily momentum and defer or
threaten a bullish count enough to warrant non-bullish decisions like
long-covers. A failure below 851.5 will not
necessarily negate a broader bullish count, but it will threaten it enough to
warrant defensive measures as the next pertinent technical levels below 851.5 are
13-Sep's prospective minor 1st-Wave high at 813.8 and obviously 08-Sep's 766.0
low. And making non-bullish decisions "down there" is
sub-optimal to say the least. Per such, both short- and longer-term
commercial traders are advised to pare or neutralize bullish exposure on a
failure below 851.5, acknowledging and accepting whipsaw risk- back above 04-Oct's
891.0 high- in exchange for much deeper and sub-optimal nominal risk below
766.0.
On
a broader scale, the daily log scale chart above shows the developing potential
for a bearish divergence in daily momentum that will be considered confirmed
below 851.5. This chart also shows the past month's recovery thus far
stalling in the immediate neighborhood of the (888.0) Fibonacci
minimum 38.2% retrace of Apr-Sep's entire 1128 - 766 decline). COMBINED
with a failure below 851.5, traders
would then need to be concerned with at least a larger-degree correction pf the
past month's rally and possibly a resumption of Apr-Sep's major downtrend.
Until
and unless the market fails below 851.5 however, we would
remind longer-term players of the key elements on which our bullish count is
predicated:
a confirmed bullish divergence in WEEKLY momentum
(below)
amidst
an
historically low 11% reading in out RJO Bullish Sentiment Index and
a
textbook complete and major 5-wave Elliott sequence down from 29-Apr's
1128 high to 08-Sep's 766.0 low.
Thus
far, the market is only a month into correcting a 4-MONTH, 32% drawdown, so
further and possibly protracted gains remain well within the bounds of a major
(suspected 2nd-Wave) correction of Apr-Sep's decline within an even more
massive PEAK/reversal process from 17-May's 1219 high on an active continuation
basis below.
These
issues considered, a bullish policy and exposure remain advised with a failure
below 851.5 required to defer or threaten this call enough to warrant moving to
a neutral/sideline position. In lieu of such weakness, we anticipate a
continuation of the past month's rally to new highs and potentially significant
gains above 891.0.
Agricultural - Corn Needs Bullish Development to Spark Short-Covering Rally
Corn Needs Bullish Development to Spark Short-Covering Rally
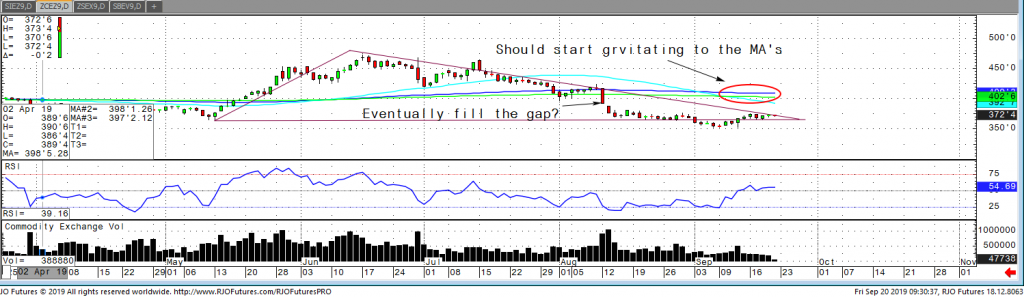
USDA’s foreign agricultural service indicated China corn production in the 12-months that start October 1st may fall to 250M tons from 257.22M this year. The short term technical action remains positive and there seems to be more upside potential in the near term as opposed to downside. The traders seem to see lower harvested acres and still potentially lower yields unless we see ideal conditions over the next 3-4 weeks. Ear weights were already considered low for the September report and those numbers can drop if harvest is cut short. The warm temps are a double-edged sword. Less chance of frost, but less time for filling on late planted crops. If harvested acres drop to 77.9 million, as opposed to 82, then ending stocks slide to 1.383 billion bushels compared to estimates of 2.190 billion. The next area of resistance comes in at 374 and 376 with support coming in at 370 and 368.
If you have any questions or would like to discuss the markets further, please feel free to contact me at 800-826-2270 or tcholly@rjofutures.com. Agricultural - Grain Futures Update w/Stephen Davis - 09/20/2019
Grain Futures Update w/Stephen Davis - 09/20/2019
By: Stephen DavisPosted 09/20/2019
RJO Futures Senior Market Strategist Stephen Davis discusses
the grain futures markets. If you have
any questions or would like to discuss the markets further, please feel free to
contact me at 800-367-7181 or sdavis@rjofutures.com.
Currency - Tug of War for U.S. Dollar Direction
Tug of War for U.S. Dollar Direction
By: Ian BannonPosted 09/19/2019
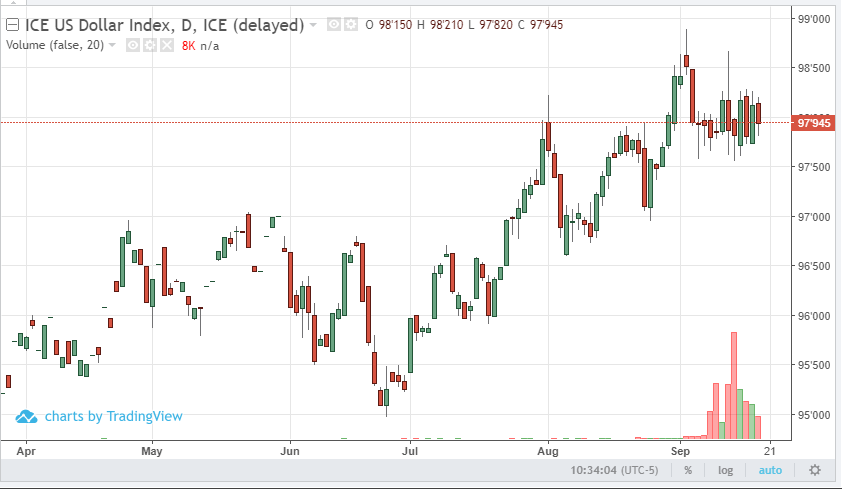
U.S. dollar futures have chopped sideways this week as
the market tests support and resistance levels around Wednesday’s Fed
announcement. The U.S. Federal Reserve cut interest rates another 25 bps, which
was largely priced into markets, then gave a somewhat hawkish testimony. Future
rate cuts are not ruled out, but certainly have not been promised either. Chairman
Powell stated that the economy is improving, sighting that labor statistics and
consumer confidence remains strong. The dollar jumped on this less-than-dovish
rhetoric as foreign currencies dipped. However, reversals were observed in
afternoon trade and again Thursday morning. Bears and bulls alike have a solid
platform to stand on. Those in the USD bear camp argue that falling corporate
profits are linked to a strong dollar (as a strong dollar deters foreign
buyers). When this corporate weakness hits the consumer, the economy will be
shaken down. In short, the Fed should work to weaken the dollar in order to
compete with suppressed currencies elsewhere.
From a technical perspective, the dollar is headed into a period of weakness in its quarterly, monthly, and weekly cycles. The last time this happened, the dollar index fell six handles. Dollar bulls argue that America’s relative strength compared to other slowing economies will attract investors to the dollar market as people look for a safer place to keep their cash. Furthermore, given the volatile spikes in the repo rate, it is clear there are liquidity and supply issues in the U.S. banking system, keeping the dollar elevated. Both camps have a credible argument. Should liquidity issues continue to squeeze the dollar higher, the hand of the Fed will be forced to unroll QE and inject more dollars into the system. Should this happen, inflation will return and elevate commodity prices, depressing the consumer and fueling the natural course of the business cycle. I believe the catalyst will be falling corporate profits.
Interest Rates - Bond Market Volatile Ahead of Fed Announcement
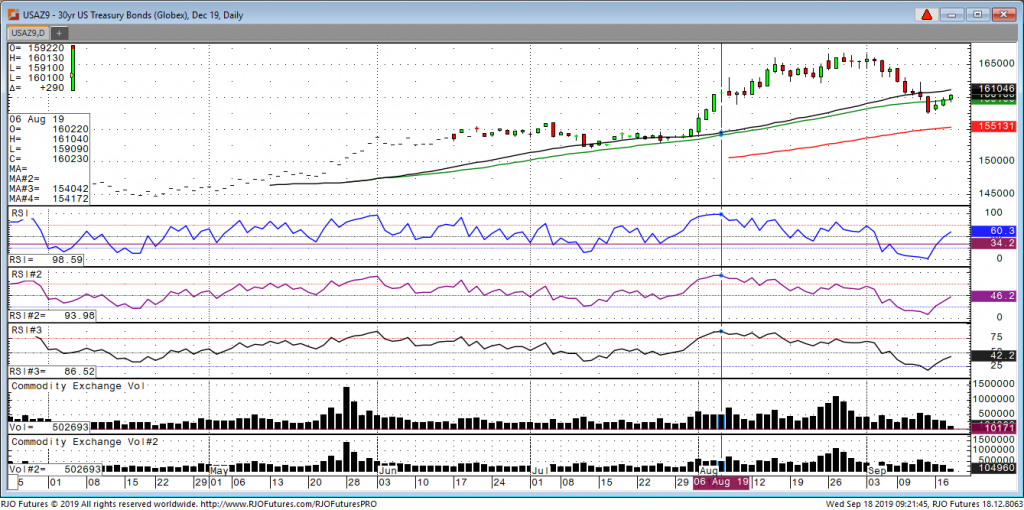
Today shapes up to be a volatile one with the Federal
Reserve widely expected to lower rates .25% with the announcement coming at
1:00 PM central. The market is expecting it and is currently priced in. The
real market mover should be what Powell says in his press conference. Do they state that they see more rate cuts
ahead? Or will todays expected cut be more of an insurance cut meaning the
economy is still doing well, but we are cutting to keep pace with the rest of
the world?
Many presume Iran was behind the attack on oil fields in Saudi Arabia this weekend, and investors bought up crude and bonds as safety and stocks sold off. Yesterday, the move in crude reversed as oil pipelines are scheduled to get back on line quicker than anticipated, and bonds lost the initial bid that was seen Monday morning. Economic data in the past few weeks has weakened a bit, but not enough for the Fed to continue a path of constant reduction of rates, even though the world economy is at a critical level where many of the world’s economy are near or at recession levels. Traders should be on their toes this afternoon as the announcement on rates comes out. However, more important than the announcement of rate cuts is what Powell says afterwards.
If you have any questions or would like to discuss the markets further, please feel free to contact me at 800-826-2270 or gperlin@rjofutures.com. Equity - Equity Futures Eye All-Time Highs Despite Developing Economic Issues
U.S. stock futures traded modestly higher Friday
morning, with even gains across all four major indices. Stocks seem to be
eyeing fresh all-time highs as uncertainty is removed from global markets in
the short term, and Chinese negotiators are in Washington for talks once more.
If all-time highs are seen again, how much more upside is there?
Economic warning signs continue to flash around the
world. Foreign equity markets are selling off as developing economies and
seasoned economies struggle to keep up with the U.S. The German GDP is
contracting, and Chinese data continues to weaken to multi-year lows. The repo
rate is warning of a domestic liquidity issue, which is keeping the dollar
elevated, thus deterring foreign purchases of U.S. products. Yes, the American
consumer remains strong, keeping U.S. growth steady. However, the saving to
investment ratio is high, indicating the consumer does not have long-term
economic confidence. Furthermore, we observed a dramatic transfer in the stock
market last week as investors swapped growth stocks for value stocks… another
sign of caution.
The most recent stock market rally has been funded by REITs and utilities, both defensive groups. Not to mention the fact that domestic manufacturing is now contractionary. The yield curve is flat, and investors still show interest in safety assets. The Fed is cutting rates with stocks near all-time highs and has confirmed that they will roll out quantitative easing when they see fit. So yes, stocks will likely move higher in the short term, but I believe we are in the late stages of economic expansion. Quarterly profits are shrinking and that is one of the best indications of rough waters ahead. A close above 3032.35 in the e-mini S&P hints at a run above 3050, while a close below 2984.25 could trigger a retracement to 2943. Investors beware; any slip-up in trade talks or trouble out of the Middle East could have a dramatic effect on equities.
Economy - S-T Mo Failure Insufficient to End RBOB Correction, But Beware
S-T Mo Failure Insufficient to End RBOB Correction, But Beware
By: RJO Market InsightsPosted 11/08/2022
Posted on Nov 08, 2022, 07:51 by Dave Toth
In Fri's Technical Webcast we identified a
minor corrective low at 2.6328 from Thur as a mini risk parameter the market
needed to sustain gains above to maintain a more immediate bullish count.
The 240-min chart below shows the market's failure overnight below this level,
confirming a bearish divergence in very short-term momentum. This mo
failure defines Fri's 2.8172 high as
one of developing importance and a parameter from which very short-term traders
can objectively base non-bullish decisions like long-covers.
Given
the magnitude of the past three weeks' broader recovery however, this
short-term momentum failure is of an insufficient scale to conclude anything
more than another correction within this broader recovery from 26-Sep's 2.1877
low. Indeed, overnights failure below 2.6328 only allows us to conclude
the end of the portion of the month-and-a-half rally from 31-Oct's 2.4822 next
larger-degree corrective low. 2.4822 is the
risk parameter this market still needs to fail below to break the uptrend from
18-Oct's 2.3526 low while this 2.3526 low
remains intact as the risk parameter this market needs to fail below to break
the month-and-a-half uptrend. From an
intermediate-to-longer-term perspective, this week's setback falls well within
the bounds of another correction ahead of further gains. This is another
excellent example of the importance of technical and trading SCALE and
understanding and matching directional risk exposure to one's personal risk
profile.
The
reason overnight's admittedly minor mo failure might have longer-term
importance is the 2.8172-area from which it stemmed. In
Fri's Technical Blog we also noted the market's engagement of the
2.8076-to-2.8159-area marked by the 61.8% retrace of Jun0-Sewp's 3.2758 -2.1877
decline and the 1.000 progression of Sep-Oct's initial 2.1877 - 2.6185
(suspected a-Wave) rally from 18-Oct's 2.3526 (suspected b-Wave) low. We
remind longer-term players that because of the unique and compelling confluence
of:
early-Aug's bearish divergence in WEEKLY momentum
amidst
historically
extreme bullish sentiment/contrary opinion levels in our RJO Bullish
Sentiment Index
an
arguably complete and massive 5-wave Elliott sequence from Mar'20's 0.4605
low to Jun's 4.3260 high (as labeled in the weekly log active-continuation
chart below) and
the
5-wave impulsive sub-division of Jun-Sep's (suspected initial 1st-Wave) decline
The
recovery attempt from 26-Sep's 2.1877 low is arguably only a 3-wave (Wave-2)
corrective rebuttal to Jun-Sep's decline within a massive, multi-quarter
PEAK/reversal process. Now granted, due to the magnitude of 2020 -2022's
secular bull market, we discussed the prospect for this (2nd-Wave corrective)
recovery to be "extensive" in terms of both price and time. A
"more extensive" correction is typified by a retracement of 61.8% or
more and spanning weeks or even months following a 3-month decline. Per
such, the (suspected corrective) recovery from 26-Sep's 2.1877 low could easily
have further to go, with commensurately larger-degree weakness than that
exhibited this week (i.e., a failure below at least 2.4822) required
to consider the correction complete. Indeed, the daily log chart above
shows the market thus far respecting former 2.6185-area resistance from 10-Oct
as a new support candidate.
These
issues considered, very shorter-term traders have been advised to move to a neutral/sideline
position following overnight's momentum failure below 2.6328, with a recovery
above 2.8172 required to negate this call, reaffirm the recovery and re-expose
potentially significant gains thereafter. For intermediate- and
longer-term players, a bullish policy and exposure remain advised with a
failure below 2.4822 required to threaten this call enough to warrant
neutralizing exposure. We will be watchful for another bearish divergence
in momentum following a recovery attempt that falls short of Fri's 2.8172 high
that would be considered the next reinforcing factor to a count calling that
2.8172 high the prospective end to the month-and-a-half 2nd-Wave
correction. In lieu of such, a resumption of the current rally to
eventual new highs above 2.8172 should not surprise.