What you should know about trading these instruments
Using the Gap trade strategy to build consistency
Agricultural Investor Kit
Opportunities Exist in the Ag Markets Right Now –
Have you ever wanted to trade the grain markets but didn’t know where to start? Are you looking for a more informed and disciplined approach to up your trading game? Then this Investor kit is for you! In this comprehensive kit you will find everything you need to help you and take advantage of the opportunities that exist in the grain markets right now!
The Markets
Metals - Gold is Broken Right Now
Gold is Broken Right Now
By: Joshua GravesPosted 10/16/2020
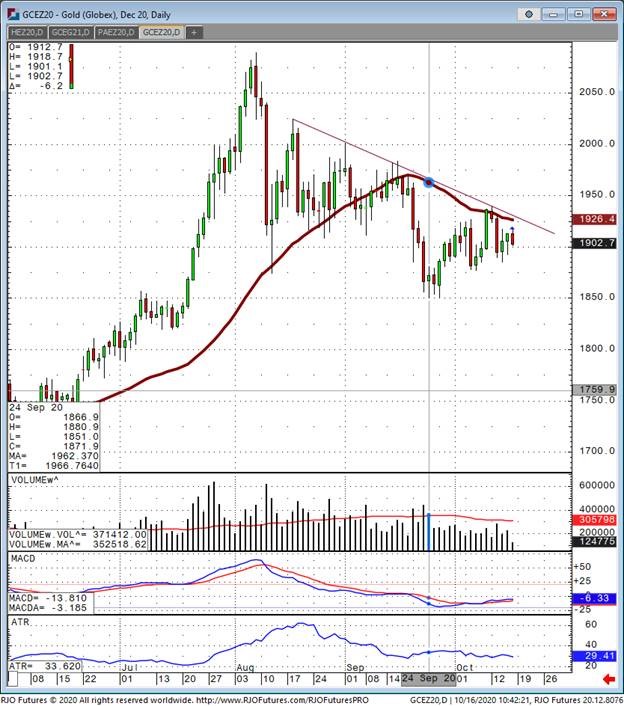
December gold futures have had anything but a calm price action the past few months, and the gradual trend is sideways to lower. Look for gold futures to continue chopping sideways to lower. Traders should be at this point focusing on two real factors and they are quite easy to understand. The first is the fundamental aspect of a stimulus bill or fed commentary that might drive the direction of gold to the upside. $1.8T is no small amount of money, double the 08 bailout to be exact, which would more likely than not drive gold back above $2000. The second factor is technical and it’s simply looking at the breakout point on the upside for a break in the lower trend we’ve been in for months. This level comes out at the 1940-1950 level, which I would think a few days of closing in this area allows traders to again step in and buy gold futures. This is not something I would be buying into until this happens. Everyone trading gold has their own theory based on fundamentals, and quite frankly nobody knows where it’s going except the managed money. If traders want to smartly trade gold they would wait for a breakout to the upside before buying and continue to trade with the trend; sounds familiar doesn’t it? The margin increases from the CME on gold futures sit around $12,000 on a full 100 oz contract, so traders should be prepared for bigger swings and if not need to utilize options instead, to which we can assist in strategy development.
Gold Dec '20 Daily ChartMetals - Silver Needs More in Order to Move Higher
Silver Needs More in Order to Move Higher
By: Eli Tesfaye, Senior Market StrategistPosted Oct 16, 2020 9:02AM CT
Dec. Silver is trading around 24.495 as I write. Interestingly, the market was around this area when I lkast wrote about silver. A succession of rejection is keeping silver from flying higher. As you can see below, we have a decent-sized flag forming that requires sustain action to come out of these congestions.
Honestly, it is impressive that the bears have been keeping silver in check with all the headlines such as the U.S. election just a few days away, the stimulus deal, and Brexit. Given the U.S. dollar index technical improvement, silver will need a great deal of news to make gains. Flight to safety type of buying hasn’t been as present as one might expect with one of the most challenging election seasons in recent history. Maybe Silver fears deflation.
For now, I think we are looking at a wait and see the type of price action. A break below $23.30 will signal further selloff. And we need to see $25.50 or above for the bulls to assert their will. For now, everything we see shows a sideway to lower type of price action. The daily dollar chart also shows a sign of turning upwards and added downside pressure on Silver.
If you have any questions or would like to discuss the markets further, please feel free to contact me at 800-367-7290 or etesfaye@rjofutures.com. Energy - Oil Focus in Demand Amid Covid
Oil Focus in Demand Amid Covid
By: Alex Turro, Senior Market StrategistPosted Oct 16, 2020 9:33AM CT
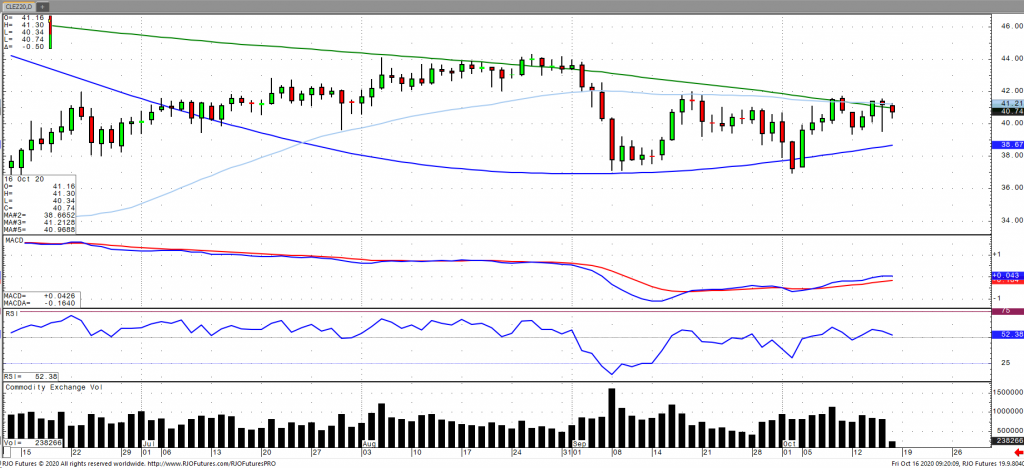
Oil prices have seen a two-sided trade this week and have formed a consolidation range but are slipping here in the early session amongst an increase in corona cases in Europe, which is only further exacerbating the grim outlook in growth and recovery in fuel demand. This comes amid some recent bullish supply side developments with continuing oil production outages in the Gulf, which is expected to wane in the near term coupled with a more than expected decline in weekly oil stocks according the EIA. OPEC+ is set to reduce supply cuts from the current 7.7 million bpd to 2 million bpd in January despite noting that the outlook for fuel usage appears ‘anemic.’ The demand outlook continues to remain bleak, which coupled with a continuing rise in supply from Libya may cause OPEC+ to extend the current production cuts into next year. Continue to keep an eye on oil volatility (OVX) with the market remaining bearish trend with today’s range seen between 38.06 – 41.90.
Crude Oil Dec '20 Daily Chart If you have any questions or would like to discuss the markets further, please feel free to contact me at 800-438-4805 or aturro@rjofutures.com. Softs - Cocoa Grinding Data and Trading Technicals
Cocoa Grinding Data and Trading Technicals
By: Peter MoosesPosted 10/15/2020
Cocoa
futures prices are feeling pressure from multiple sources. Grinding data is
being released this week – most traders are anticipating levels lower than last
year at this time. Demand is a continued issue for cocoa as we move closer to
the holiday season. European markets have also shown a weaker currency and
equity trade – adding to the global pressure this commodity is facing.
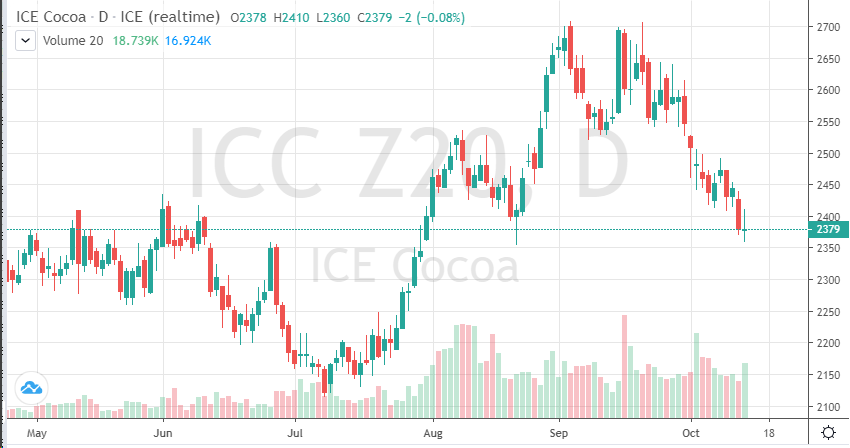
Technically, the December cocoa chart looks bearish, but oversold. Look for support to hold at these current levels. The market should be strong enough to hold above 2335 even after all the grinding data is released this week. Look for opportunities at these levels, a positive earnings reports or weaker production data can send prices back above 2500. As we get closer to the US election and closer to year end, look for continued volatility across the board.
On
the heels of mid-Sep-to-early-Oct's steeper, accelerated, 3rd-wave-looking
recovery, the past week-and-a-half's boringly lateral chop is first considered
a corrective/consolidative event that warns of a continuation of the uptrend
that preceded it to new highs above 04-Oct's 891.0 high. This count
remains consistent with our broader base/correction/recovery count introduced
in 13-Sep's Technical Blog following that
day's bullish divergence in short-term momentum above 07-Sep's 809.5 minor
corrective high detailed in the hourly chart below.
The
important takeaway from this month's lateral, sleepy price action is the
definition of Wed's 851.5 low as
the end or lower boundary of a suspected 4th-Wave correction. A failure
below 851.5 will confirm a bearish divergence in daily momentum and defer or
threaten a bullish count enough to warrant non-bullish decisions like
long-covers. A failure below 851.5 will not
necessarily negate a broader bullish count, but it will threaten it enough to
warrant defensive measures as the next pertinent technical levels below 851.5 are
13-Sep's prospective minor 1st-Wave high at 813.8 and obviously 08-Sep's 766.0
low. And making non-bullish decisions "down there" is
sub-optimal to say the least. Per such, both short- and longer-term
commercial traders are advised to pare or neutralize bullish exposure on a
failure below 851.5, acknowledging and accepting whipsaw risk- back above 04-Oct's
891.0 high- in exchange for much deeper and sub-optimal nominal risk below
766.0.
On
a broader scale, the daily log scale chart above shows the developing potential
for a bearish divergence in daily momentum that will be considered confirmed
below 851.5. This chart also shows the past month's recovery thus far
stalling in the immediate neighborhood of the (888.0) Fibonacci
minimum 38.2% retrace of Apr-Sep's entire 1128 - 766 decline). COMBINED
with a failure below 851.5, traders
would then need to be concerned with at least a larger-degree correction pf the
past month's rally and possibly a resumption of Apr-Sep's major downtrend.
Until
and unless the market fails below 851.5 however, we would
remind longer-term players of the key elements on which our bullish count is
predicated:
a confirmed bullish divergence in WEEKLY momentum
(below)
amidst
an
historically low 11% reading in out RJO Bullish Sentiment Index and
a
textbook complete and major 5-wave Elliott sequence down from 29-Apr's
1128 high to 08-Sep's 766.0 low.
Thus
far, the market is only a month into correcting a 4-MONTH, 32% drawdown, so
further and possibly protracted gains remain well within the bounds of a major
(suspected 2nd-Wave) correction of Apr-Sep's decline within an even more
massive PEAK/reversal process from 17-May's 1219 high on an active continuation
basis below.
These
issues considered, a bullish policy and exposure remain advised with a failure
below 851.5 required to defer or threaten this call enough to warrant moving to
a neutral/sideline position. In lieu of such weakness, we anticipate a
continuation of the past month's rally to new highs and potentially significant
gains above 891.0.
Agricultural - Live Cattle in a Rut
Live Cattle in a Rut
By: Peter McGinnPosted 10/16/2020
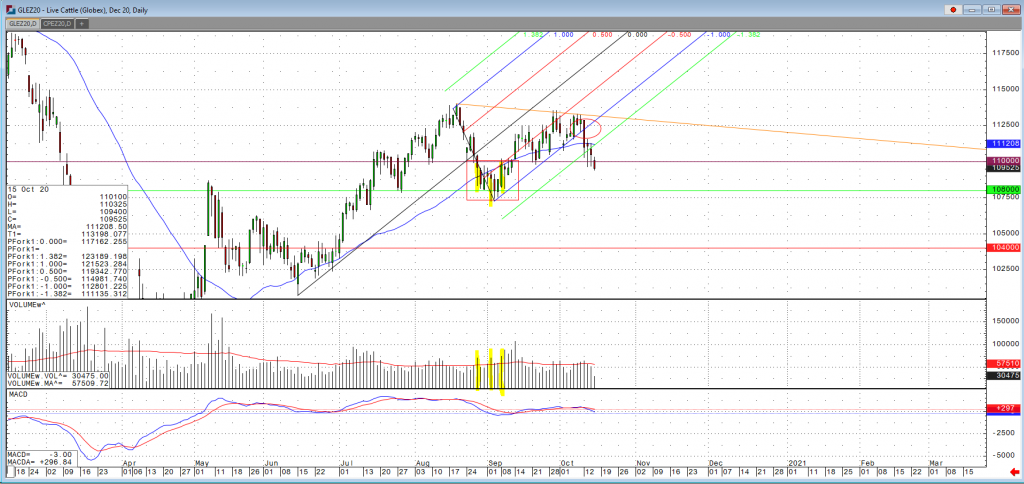
Dec cattle has closed lower today for the 5th time in the last 6 sessions, with the outlook of weaker seasonal demand and a cash market starting to trend lower cattle futures are now trending down back into price level we saw back in the beginning of September. Beef supply is still high with weights being at a 5 year high so even if we get a slight increase in slaughter numbers, that would put additional pressure on the market possibly bringing prices down to the early July levels of $106. With Dec cattle’s close under 109.65, the market has looked to violate $110 level and would look to continue to trend lower. In Nebraska 1,720 head traded at $107-$108 and an average price of $107.62 versus $108.16 last week. In Texas/Oklahoma 4,811 head traded at $108-$108.25 and an average price of $108.02 versus $108.90 last week. The USDA estimated cattle slaughter came in at 119,000 head yesterday. This brings the total for the week so far to 356,000 head, up from 355,000 last week and up from 351,000 a year ago. December cattle closed moderately lower on the session yesterday and the selling pushed the market down to the lowest level since September 11. Outside market forces are bearish with a negative tilt toward the economy as virus cases are on the rise in the US and around the world.
Live Cattle Dec '20 Daily ChartEquity - Stocks Up on Retail Sales
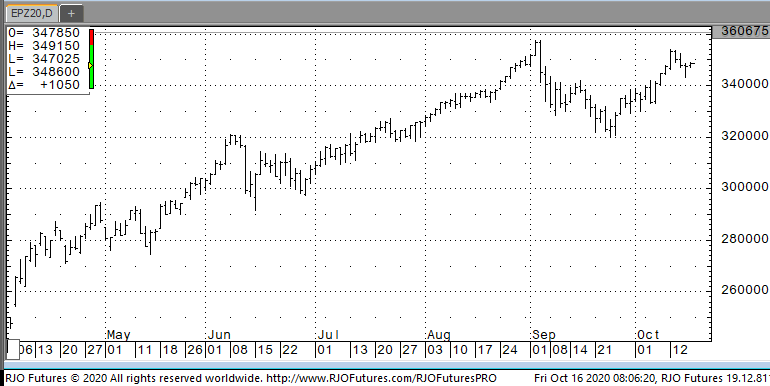
Stocks Up on Retail Sales
By: Jeff Yasak, Senior Market StrategistPosted Oct 16, 2020 8:55AM CT
U.S. Stock futures
are up this morning after a strong retail sales number and very promising news
on a Covid-19 vaccine from Pfizer.
According the U.S. Census Bureau “Advance estimates of U.S. retail and
food services sales for September 2020, adjusted for seasonal variation and
holiday and trading-day differences, but not for price changes, were $549.3
billion, an increase of 1.9 percent (± 0.5 percent) from the previous month,
and 5.4 percent (± 0.7 percent) above September 2019. Total sales for the July
2020 through September 2020 period were up 3.6 percent (± 0.5 percent) from the
same period a year ago. The July 2020 to August 2020 percent change was
unrevised at up 0.6 percent (± 0.2 percent). Retail trade sales were up 1.9
percent (± 0.5 percent) from August 2020, and 8.2 percent (± 0.7 percent) above
last year. Non-store retailers were up 23.8 percent (± 1.6 percent) from
September 2019, while building material and garden equipment and supplies
dealers were up 19.1 percent (± 2.1 percent) from last year.”
Also, this morning,
Pfizer Inc stated that is applying for emergency use of their experimental
Covid-19 vaccine that they are co-developing with BioNtech SA. This could come as soon as the end of
November. This is a bit longer than they had first anticipated but it will be
filed once two months of safety data are compiled per FDA rules. This news had
Pfizer shares trading up 53% in the premarket.
Support today is 345000 and 341500 with resistance showing 351000 and 352500
E-mini S&P 500 Dec '20 Daily Chart If you have any questions or would like to discuss the markets further, please feel free to contact me at 888-861-1656 or jyasak@rjofutures.com. Economy - S-T Mo Failure Insufficient to End RBOB Correction, But Beware
S-T Mo Failure Insufficient to End RBOB Correction, But Beware
By: RJO Market InsightsPosted 11/08/2022
Posted on Nov 08, 2022, 07:51 by Dave Toth
In Fri's Technical Webcast we identified a
minor corrective low at 2.6328 from Thur as a mini risk parameter the market
needed to sustain gains above to maintain a more immediate bullish count.
The 240-min chart below shows the market's failure overnight below this level,
confirming a bearish divergence in very short-term momentum. This mo
failure defines Fri's 2.8172 high as
one of developing importance and a parameter from which very short-term traders
can objectively base non-bullish decisions like long-covers.
Given
the magnitude of the past three weeks' broader recovery however, this
short-term momentum failure is of an insufficient scale to conclude anything
more than another correction within this broader recovery from 26-Sep's 2.1877
low. Indeed, overnights failure below 2.6328 only allows us to conclude
the end of the portion of the month-and-a-half rally from 31-Oct's 2.4822 next
larger-degree corrective low. 2.4822 is the
risk parameter this market still needs to fail below to break the uptrend from
18-Oct's 2.3526 low while this 2.3526 low
remains intact as the risk parameter this market needs to fail below to break
the month-and-a-half uptrend. From an
intermediate-to-longer-term perspective, this week's setback falls well within
the bounds of another correction ahead of further gains. This is another
excellent example of the importance of technical and trading SCALE and
understanding and matching directional risk exposure to one's personal risk
profile.
The
reason overnight's admittedly minor mo failure might have longer-term
importance is the 2.8172-area from which it stemmed. In
Fri's Technical Blog we also noted the market's engagement of the
2.8076-to-2.8159-area marked by the 61.8% retrace of Jun0-Sewp's 3.2758 -2.1877
decline and the 1.000 progression of Sep-Oct's initial 2.1877 - 2.6185
(suspected a-Wave) rally from 18-Oct's 2.3526 (suspected b-Wave) low. We
remind longer-term players that because of the unique and compelling confluence
of:
early-Aug's bearish divergence in WEEKLY momentum
amidst
historically
extreme bullish sentiment/contrary opinion levels in our RJO Bullish
Sentiment Index
an
arguably complete and massive 5-wave Elliott sequence from Mar'20's 0.4605
low to Jun's 4.3260 high (as labeled in the weekly log active-continuation
chart below) and
the
5-wave impulsive sub-division of Jun-Sep's (suspected initial 1st-Wave) decline
The
recovery attempt from 26-Sep's 2.1877 low is arguably only a 3-wave (Wave-2)
corrective rebuttal to Jun-Sep's decline within a massive, multi-quarter
PEAK/reversal process. Now granted, due to the magnitude of 2020 -2022's
secular bull market, we discussed the prospect for this (2nd-Wave corrective)
recovery to be "extensive" in terms of both price and time. A
"more extensive" correction is typified by a retracement of 61.8% or
more and spanning weeks or even months following a 3-month decline. Per
such, the (suspected corrective) recovery from 26-Sep's 2.1877 low could easily
have further to go, with commensurately larger-degree weakness than that
exhibited this week (i.e., a failure below at least 2.4822) required
to consider the correction complete. Indeed, the daily log chart above
shows the market thus far respecting former 2.6185-area resistance from 10-Oct
as a new support candidate.
These
issues considered, very shorter-term traders have been advised to move to a neutral/sideline
position following overnight's momentum failure below 2.6328, with a recovery
above 2.8172 required to negate this call, reaffirm the recovery and re-expose
potentially significant gains thereafter. For intermediate- and
longer-term players, a bullish policy and exposure remain advised with a
failure below 2.4822 required to threaten this call enough to warrant
neutralizing exposure. We will be watchful for another bearish divergence
in momentum following a recovery attempt that falls short of Fri's 2.8172 high
that would be considered the next reinforcing factor to a count calling that
2.8172 high the prospective end to the month-and-a-half 2nd-Wave
correction. In lieu of such, a resumption of the current rally to
eventual new highs above 2.8172 should not surprise.